
Fig 4.
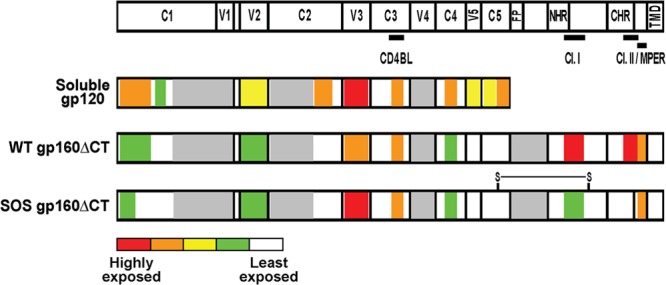
Summary of soluble gp120 and VLP Env epitope exposure. Schematic representations of soluble gp120 and VLP Env epitope exposure are shown, derived from the data of Fig. 2. The epitopes of the CD4 binding loop (CD4BL), gp41 cluster I (Cl. I) and cluster II (Cl. II), and MPER are indicated. The disulfide linkage on SOS gp160ΔCT is represented as “S-S.” Other abbreviations: FP, fusion peptide; NHR and CHR, N-heptad repeat and C-heptad repeat, respectively; TMD, transmembrane domain. The mean titer of MAb binding to each domain was calculated for each antigen. The relative exposure of Env domains is labeled according to the color scheme in Fig. 2. Warmer colors therefore indicate a greater epitope exposure; the most accessible regions are red, and the least accessible segments are white. Gray domains indicate unknown exposure due to a lack of MAbs.