Fig 1.
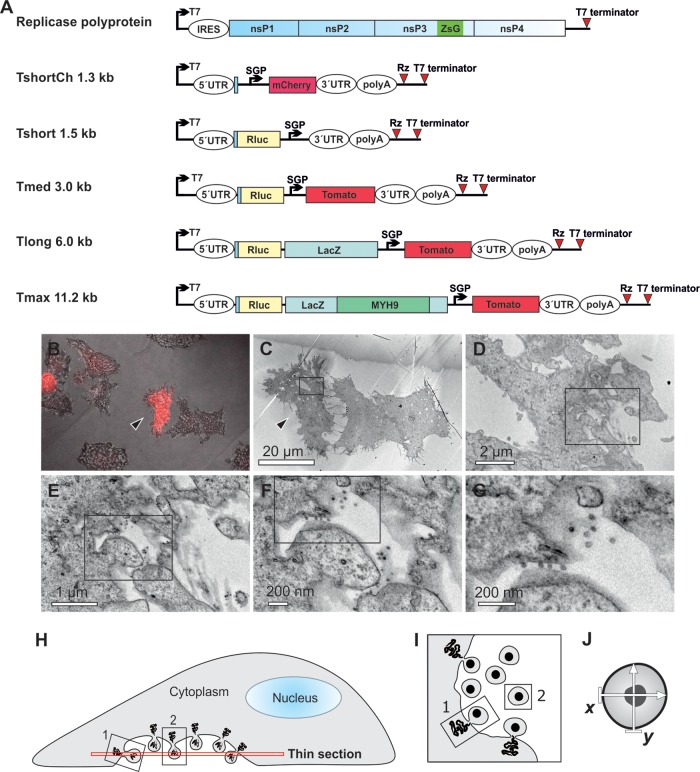
Visualization of the replication of RNA templates by CLEM and analysis of spherule size. (A) Schematic of the SFV replicase polyprotein and template constructs used in the present study. The size of the templates, excluding poly(A), is indicated. Both the polyprotein mRNA (containing an internal ribosome entry site [IRES]) and the template RNAs (containing viral 5′ and 3′ untranslated regions [UTRs]) are expressed from T7 promoters. ZsG indicates the fluorescent protein ZsGreen fused with replicase protein nsP3, and SGP indicates SFV subgenomic promoter, which directs the expression of red fluorescent markers mCherry or Tomato from the template RNA. Rluc, Renilla luciferase; LacZ, β-galactosidase; MYH9, myosin 9 heavy chain; Rz, hepatitis delta virus antigenomic ribozyme. (B to G) After cotransfection of polyprotein and TshortCh template constructs, CLEM technique was used to visualize the identified replication-positive cells (red in panel B, marked with an arrowhead in panels B and C) at the EM level (C to G). Boxes indicate the area shown in the subsequent higher-magnification image. (H to J) Schematic of the sectioning of cells and EM analysis of spherules. Thin sections were made horizontally starting from the bottom (H). Plentiful spherules were commonly detected on the bottom plasma membrane that was facing the cell culture dish. In these sections, most spherules are cut as indicated for spherule number 2 and therefore appear to be dissociated from the plasma membrane (I), although they are always connected to it by a neck structure above the plane of the section. In the bottom sections spherules that are cut “sideways,” like spherule number 1, and thus showing the neck, are more rare. We have not observed differences in size when spherule sizes have been measured in the two different cutting orientations. The diameter of each spherule was defined as the average of two orthogonally measured distances (J).

