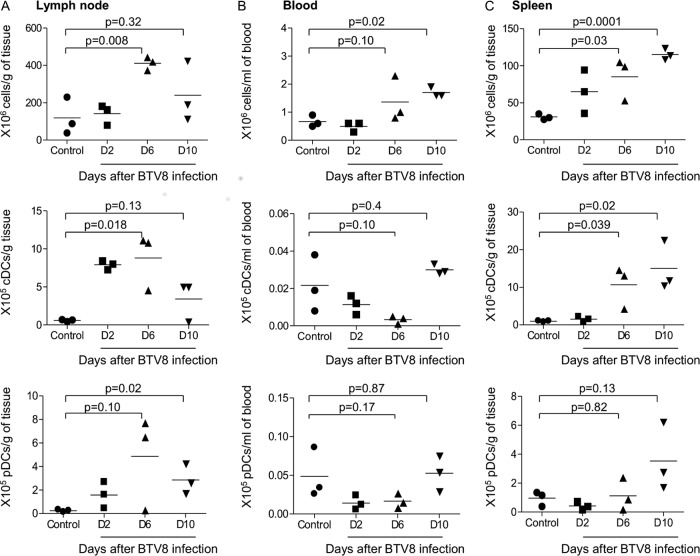
Fig 1.
Representation of cDCs and pDCs in the draining lymph nodes (A), blood (B), and spleen (C) during BTV infection. cDCs and pDCs were labeled from LD cell preparations of lymph nodes, blood, and spleen as in Fig. S1 in the supplemental material. The percentage of DCs among other cells was used to calculate their total number representation within the initial tissue and blood sample. Total numbers of leukocytes (top panels), cDCs (middle panels), and pDCs (bottom panels) were reported per gram of tissue or per ml of blood. Three different sheep were used per time point (control and D2, D6, and D10 postinfection).

