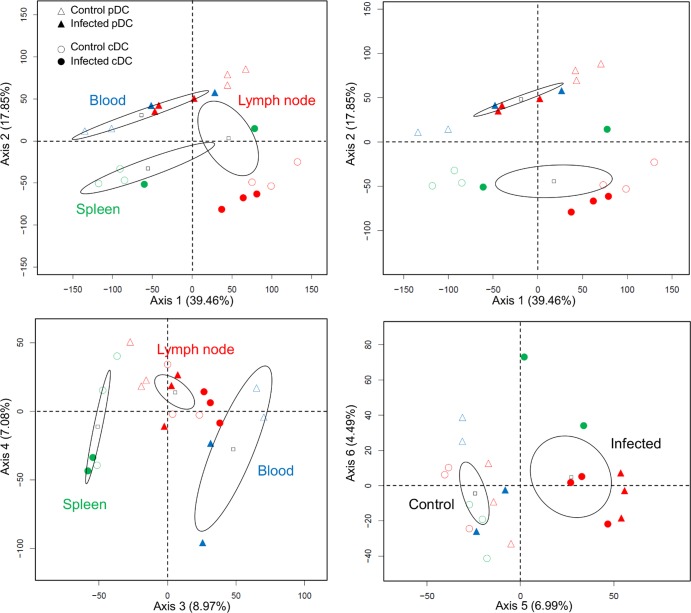
Fig 3.
PCA on the microarray data from node, spleen, and blood cDCs and pDCs in control and BTV-infected sheep (D6). A PCA of the normalized gene chips data from the spleen, lymph node, and blood pDCs (triangles) and cDCs (circles) of control (empty symbols) and infected sheep (filled symbols) generated 6 axes. Axis 1 separated samples according to lymphoid organs, axis 2 according to DC types, axis 3 according to organs, and axis 5 according to BTV infection status.

