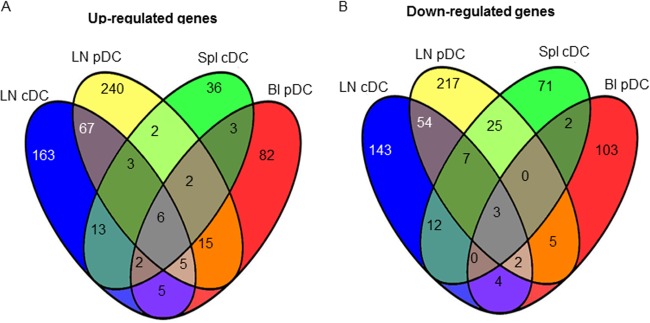
Fig 4.

Venn diagram comparison of the genes upregulated (A) and downmodulated (B) by BTV in lymph node pDCs, in lymph node cDCs, in blood pDCs, and in spleen cDCs. Each of the four circles represents the list of the DG in the different DC subsets from the mentioned lymphoid organ (Spl, spleen; Bl, blood; LN, lymph node). Numbers in the intersections between circles represent the numbers of common genes that are modulated in two, three, or four subset types.
