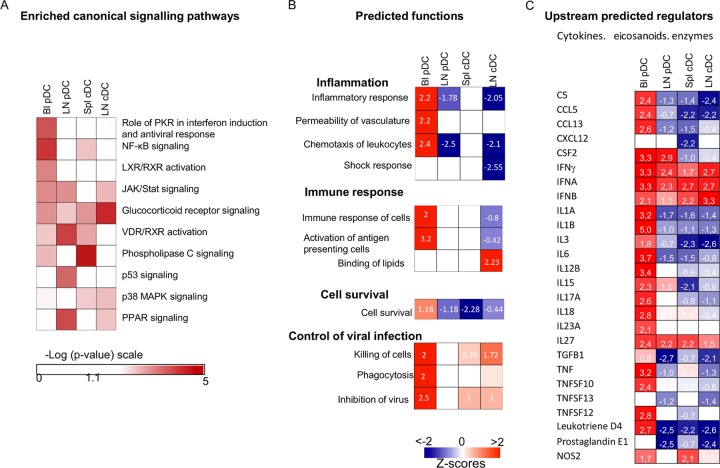
Fig 5.
Enrichment for canonical pathways and prediction of functions and of upstream regulators in blood and lymph node pDCs and in lymph node and spleen cDCs upon BTV infection. The DEG lists in blood and node pDCs and in node and spleen cDCs were processed by the IPA software and the DEA tool. (A) Heat map of the enriched canonical signaling pathways [−Log (P values) in a red scale]. (B and C) Heat map of the generated statistically significant prediction values for activated and inhibited functions (B) and upstream regulators (C), with z-scores of >2 for activation and <−2 for inhibition. z-scores are reported in each square.

