
Fig 3.
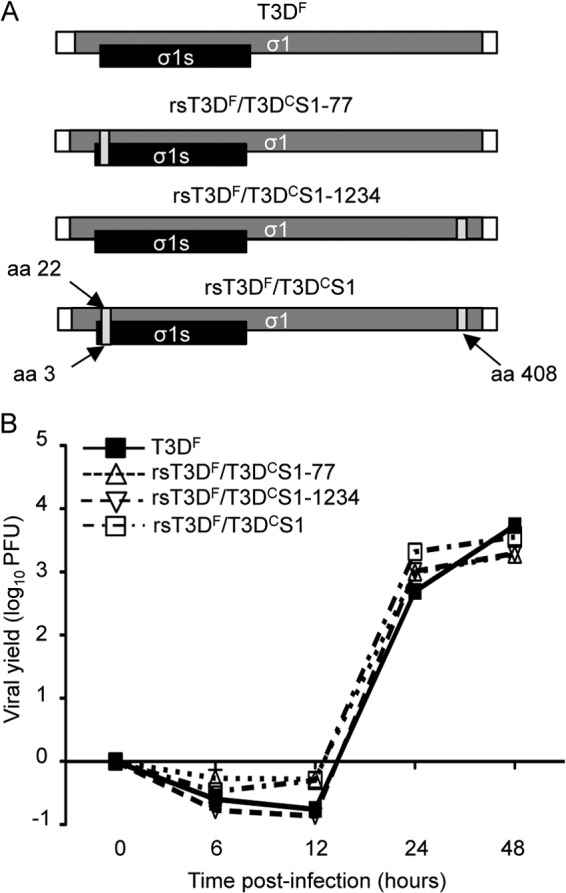
Construction and characterization of T3DF viruses with T3DC sequences in the S1 gene. (A) Schematic of the reovirus S1 gene segment. The σ1 ORF is shown in gray, the σ1s ORF is shown in black, and the 5′ and 3′ UTRs are represented by white rectangles. Each T3DC nucleotide change in the T3DF S1 gene is represented by a dark gray bar. (B) Replication of recombinant viruses. L929 cells were adsorbed with T3DF, rsT3DF/T3DCS1-77, rsT3DF/T3DCS1-1234, or rsT3DF/T3DCS1 at an MOI of 5 PFU/cell. Viral titers were determined at the indicated times postadsorption by plaque assay using L929 cells. The results are expressed as viral yields for triplicate samples. Error bars indicate standard deviations (SD).