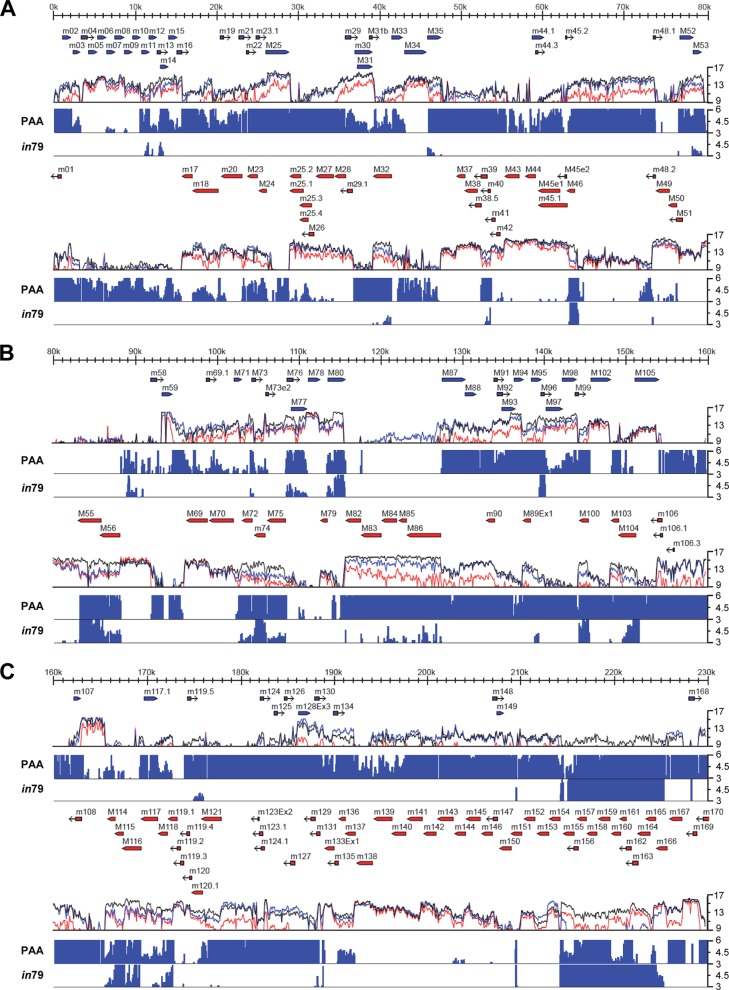
Fig 7.
Tiled array analysis of genome-wide transcription during MCMV infection. MEF10.1 cells were infected with SMgfp in the presence or absence of PAA or with SMin79 at an MOI of 2. Total RNA was isolated at 20 hpi and reverse transcribed, and labeled cDNAs were hybridized to an oligonucleotide tiled array of the MCMV genome. The mean fluorescence of probes overlapping each nucleotide position is plotted on a log2 scale underneath the annotated viral genomic sequence. Blue or red arrows represent annotated open reading frames on the positive or negative strand of the viral genome, respectively. The colored lines represent the transcriptional signals from SMgfp infection (black), SMgfp infection with PAA (red), and SMin79 infection (blue). These probe intensities were compared on a nucleotide-by-nucleotide basis between SMgfp infections with and without PAA treatment or between infections of SMgfp and SMin79. Regions in which the fluorescence intensity was reduced by greater than 3-fold by PAA treatment (PAA) or mutation of M79 (in79) are plotted on a linear scale as fold reduction below the transcriptional intensity plots. Genomic sequences are as follows: 1 to 80 kb (A), 80 to 160 kb (B), and 160 to 230 kb (C). Shown is a representative result from two reproducible, independent experiments.

