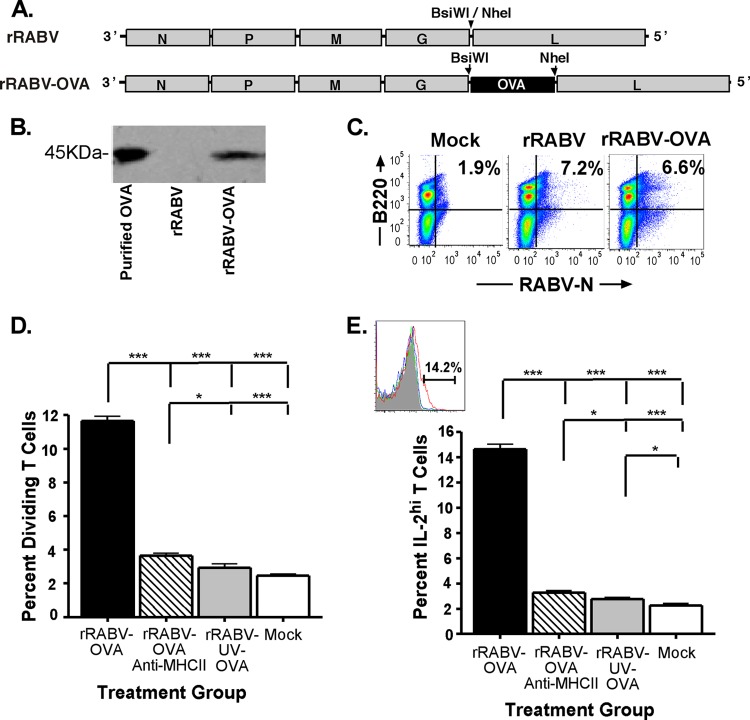
Fig 6.
Isolated naive mouse splenic B cells infected with rRABV-OVA stimulate proliferation and IL-2 secretion of naive OVA-specific OT-II CD4+ T cells in an in vitro coculture assay. Splenic B cells were isolated to a purity of >95% B220+ B cells and either mock infected with medium or infected at an MOI of 5 with rRABV-OVA, inactivated rRABV-UV-OVA, or rRABV-OVA combined with a I-Ab MHC-II blocking antibody. Infected B cells were cocultured with CellTrace-violet-stained isolated OT-II T cells (>92% CD3ε+ CD4+) for 120 h, and then harvested cells were stained for intracellular IL-2 and analyzed as described in Materials and Methods. (A) rRABV expressing ovalbumin (OVA) was constructed by cloning the chicken ovalbumin gene into the rRABV backbone, taking advantage of restriction enzyme sites inserted between the glycoprotein (G) and polymerase (L) genes. rRABV-OVA was recovered, characterized, and grown on baby hamster kidney cells. rRABV-UV-OVA was inactivated by UV light exposure for 10 min to <10 FFU/ml. (B) Western blot for ovalbumin from supernatants of neuroblastoma cell cultures infected with rRABV or rRABV-OVA. Purified chicken ovalbumin protein was included as a control. (C) Representative dot plots of B220+ RABV-N+-infected B cells from naive mouse splenocytes that were mock infected or infected at an MOI of 5 with rRABV-OVA or rRABV for 2 days. (D) Dividing CD4+ T cells, determined by diminution of CellTrace-violet staining intensity as a percentage of total CD4+ T cells from in vitro cocultures that were mock infected or exposed to rRABV-OVA, rRABV-OVA plus anti-MHC-II blocking antibody, or rRABV-UV-OVA for 120 h. (E) IL-2hi CD4+ T cells, determined by intracellular antibody staining as a percentage of total CD4+ T cells from in vitro cocultures exposed to rRABV-OVA, rRABV-OVA plus anti-MHC-II blocking antibody, rRABV-UV-OVA, or mock infection for 120 h. The inset shows a representative gating strategy histogram for IL-2hi CD4+ T cells. To compare two groups of data, we used an unpaired, two-tailed Student's t test (*, P < 0.05; ***, P < 0.001).

