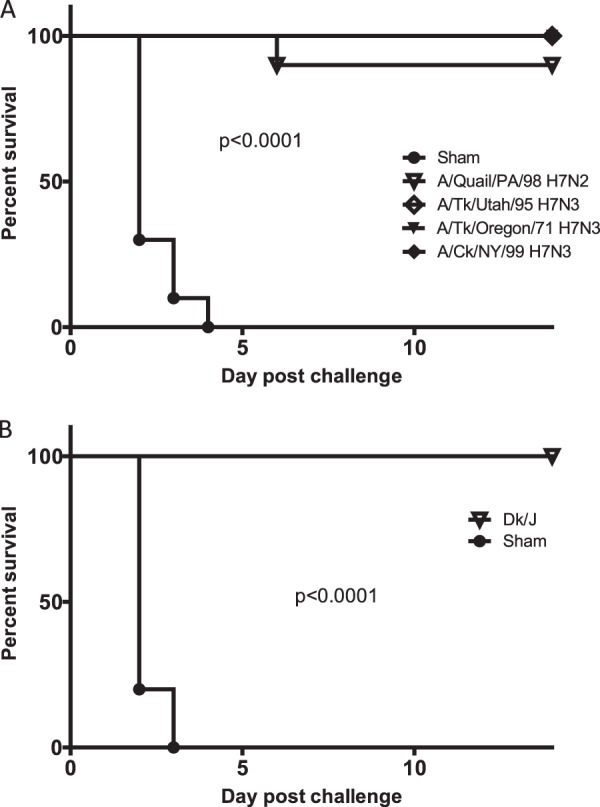
Fig 4.

Kaplan-Meier survival plots for challenge experiments I and II. (A) Percent survival versus day postchallenge with A/Ck/Jalisco/CPA1/2012 H7N3 HPAI virus for groups vaccinated with U.S. isolates A/turkey/Utah/24721-10/1995 (H7N3), A/turkey/Oregon/1971 (H7N3), A/chicken/New York/12273-11/1999 (H7N3), and A/quail/Pennsylvania/20304/1998 (H7N2). (B) Birds vaccinated with A/Cinnamon Teal/Mexico/2817/2006 (H7N3) and challenged with A/chicken/Jalisco/CPA1/2012. Statistical significance in survival curves between the sham-vaccinated and vaccinated groups was determined by the log-rank (Mantel-Cox) test (P < 0.05).
