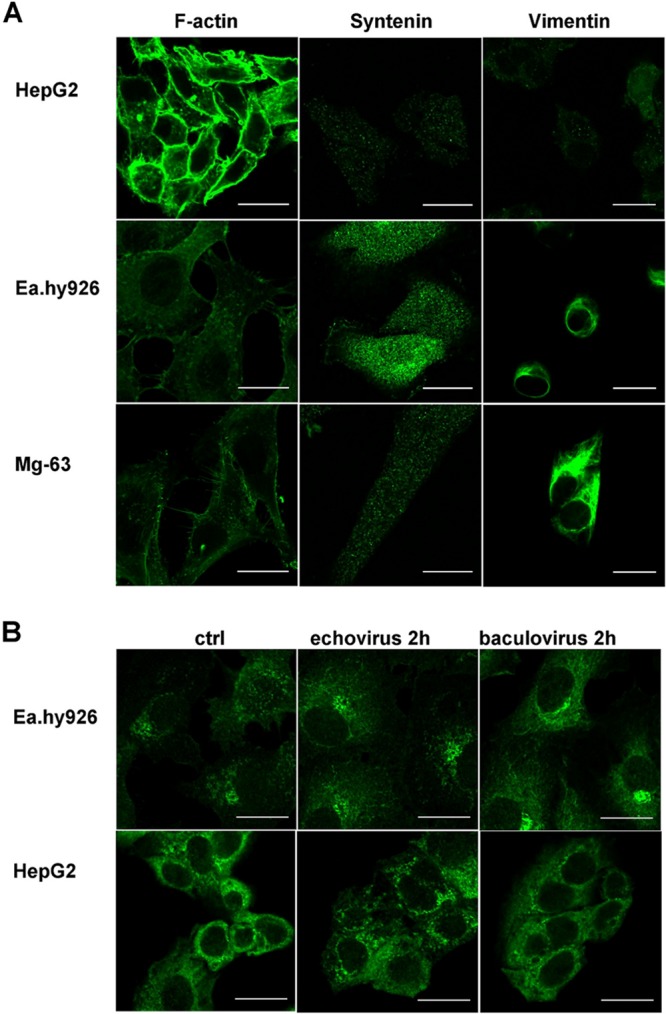
Fig 3.

Nonpermissive and permissive cell lines show differences in expression patterns of F-actin, syntenin, vimentin, and pPKCα. (A) Immunolabeling of syntenin and vimentin in different cell types. Actin was labeled using TRITC-conjugated phalloidin. (B) pPKCα immunolabeled from untreated (control [ctrl]) or virus-treated (virus 2 h p.i.) Ea.hy926 and HepG2 cells. Scale bars, 20 μm.
