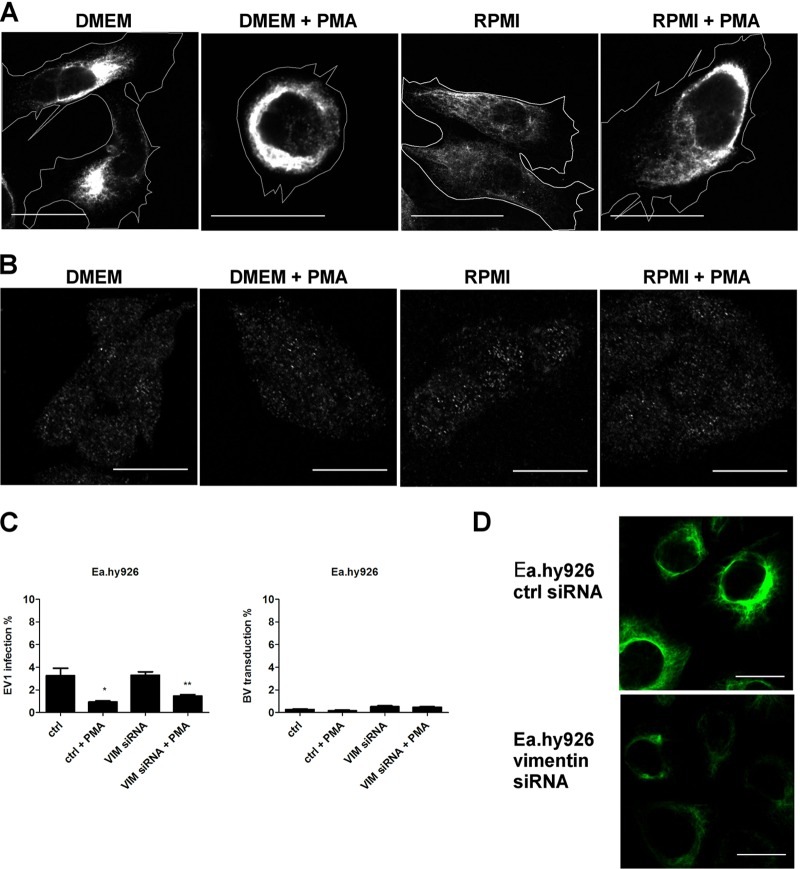
Fig 7.
PMA treatment modulates cellular distribution of vimentin to a more restrictive phenotype in Ea.hy926 cells. (A) Vimentin was immunolabeled from Ea.hy926 after PMA treatment (30 min) and imaged with a confocal microscope. Cell outlines are shown. (B) Vimentin in HepG2 cells after similar treatments. (C) EV1 infection (8 × 10⁷ PFU/ml) and BV transduction (MOI, 500) were determined after siRNA transfection and subsequent PMA treatment (30 min). The error bars indicate SEM. (D) Vimentin knockdown efficiency after siRNA transfection (120 h) in Ea.hy926 cells was evaluated by immunolabeling. Scale bars, 20 μm. The error bars indicate SEM. *, P < 0.05; **, P < 0.01.

