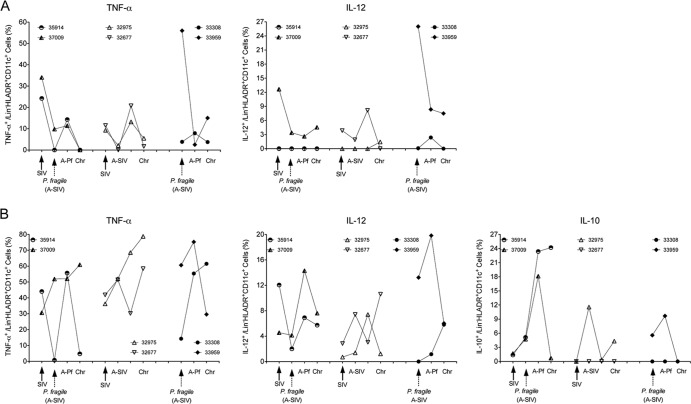
Fig 2.
TLR7/8 responses of peripheral blood mDC and monocytes. (A and B) The percentages of cytokine-positive mDC or monocytes, respectively, after in vitro stimulation with the TLR7/8 ligand R848. PBMC from animals in the various infections groups were analyzed for the production of TNF-α, IL-12, and IL-10. The experimental groups are ordered in the following order, from left to right on the x axis: SIV-P. fragile coinfection, SIV infection, and P. fragile infection. Individual animals in each group are represented by a specific symbol, as indicated in the graph. Results are shown for the time points corresponding to the time of SIV infection (DPI-SIV 0) or P. fragile (DPI-Pf 0/DPI-SIV 28) infection, the time of acute SIV infection (A-SIV and DPI-SIV 28; equivalent to the time of P. fragile infection in coinfected animals), acute P. fragile infection (A-Pf and DPI-SIV 35 to 49/DPI-Pf 7 to 21), and the chronic phase (Chr) of infection (DPI-SIV 84 to 112/DPI-Pf 42 to 84). See the text for further details.

