Fig 4.
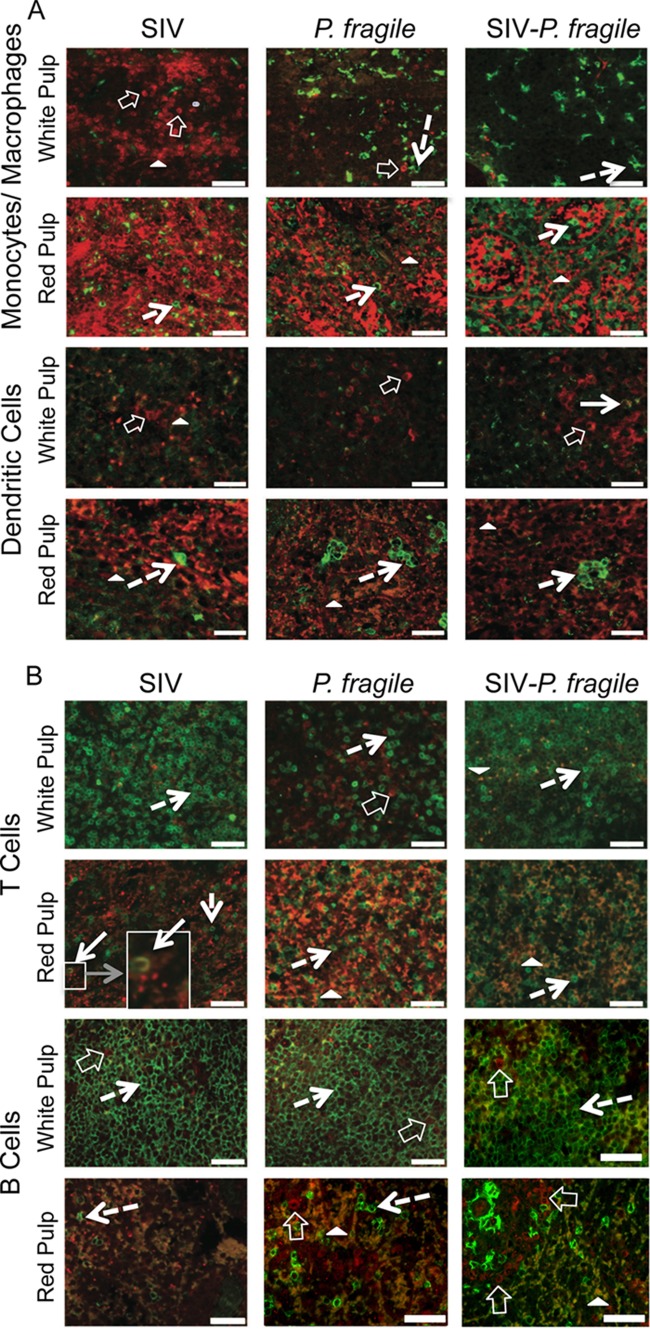
IL-10 expression in spleen. Immunofluorescence was used to determine the phenotype of IL-10-producing cells in the red and white pulp of the spleen. Representative tissue sections of SIV-, P. fragile-, and SIV-P. fragile-infected animals at necropsy are shown. Images were stained with IL-10 (red) and the relevant lineage markers (green) for monocyte/macrophages (CD68), dendritic cells (CD205/DC-SIGN), T cells (CD3), or B cells (CD20). Panel A shows images for monocytes/macrophages and dendritic cells, and panel B includes the relevant images for T and B cells. Negative controls were performed via staining with appropriate isotype controls, and images were acquired and analyzed as positively stained sections (Fig. 6). White bars represent 50 μm. Despite the strong autofluorescence of red cells (closed white triangle) in the red pulp of the spleen, IL-10-positive cells could be clearly identified. Single cells positive for IL-10 are indicated by clear white block arrows, and lineage marker-positive cells are pointed out by dashed arrows. The boxed area and its enlargement in the SIV example shows a CD3-positive cell that is also positive for IL-10 (white arrow).

