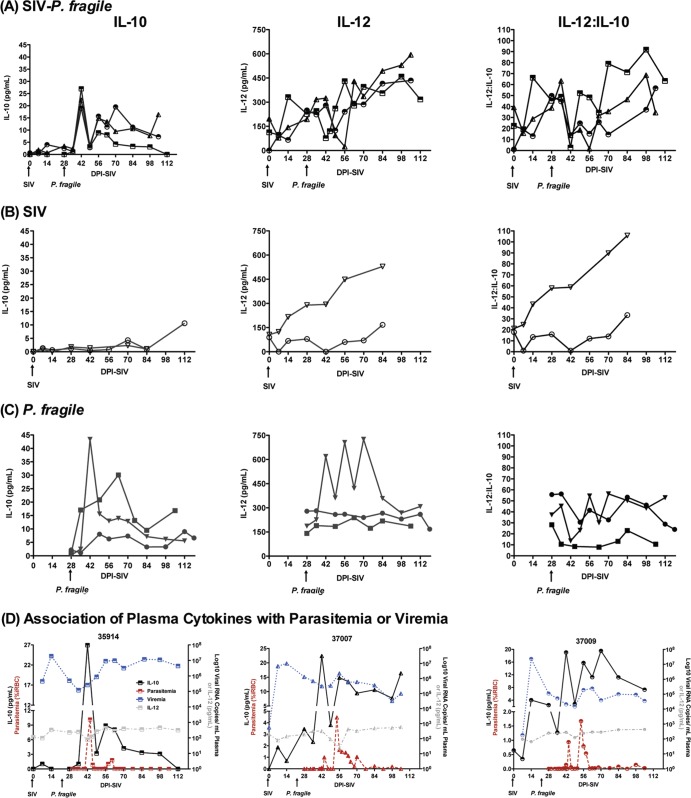
Fig 9.
Plasma cytokine levels. Plasma IL-10 (left column) and IL-12 (middle column) levels were determined in longitudinally collected plasma samples by ELISA of SIV-P. fragile (A)-, SIV (B)-, or P. fragile (C)-infected animals. Individual animals are denoted by different symbols. The ratio of plasma IL-12 to IL-10 (with cytokine-negative samples being assigned a value of 5 pg/ml, the limit of detection) are shown in the right column. (D) The temporal association between plasma viremia or parasitemia with plasma IL-10 or IL-12 levels.

