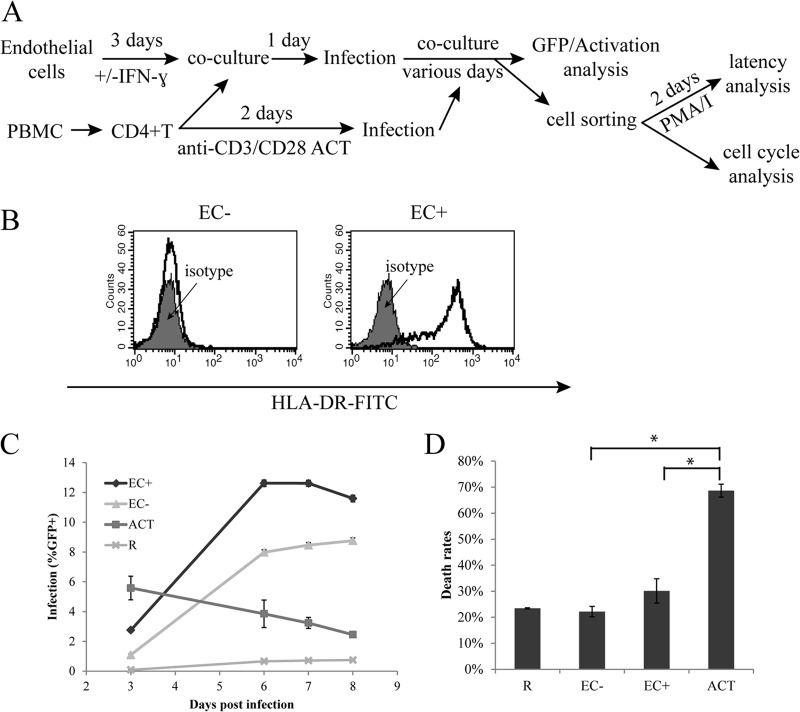
Fig 1.
Viral infection of resting CD4+ T cells cocultured with endothelial cells. (A) General scheme of EC and CD4+ T cell coculture and infection. (B) Expression of HLA-DR in EC− and EC+ cells. FITC, fluorescein isothiocyanate. (C) Kinetics of infection. Endothelial cells treated with IFN-γ or without IFN-γ treatment were cocultured with resting CD4+ T cells and infected with a reporter virus expressing GFP. Expression of GFP was measured on days 3 to 8 postinfection. Resting T cells alone and CD3/28-activated T cells were included as controls. (D) Death rates of infected resting CD4+ T cells alone or in EC cocultures. Measurements were taken 5 days postinfection. Death rates were calculated as the number of dead cells over the number of total cells. Panels C and D show the means ± standard errors of quadruplicate and duplicate samples, respectively, and are representative of at least three experiments. *, P < 0.05, Student t test.

