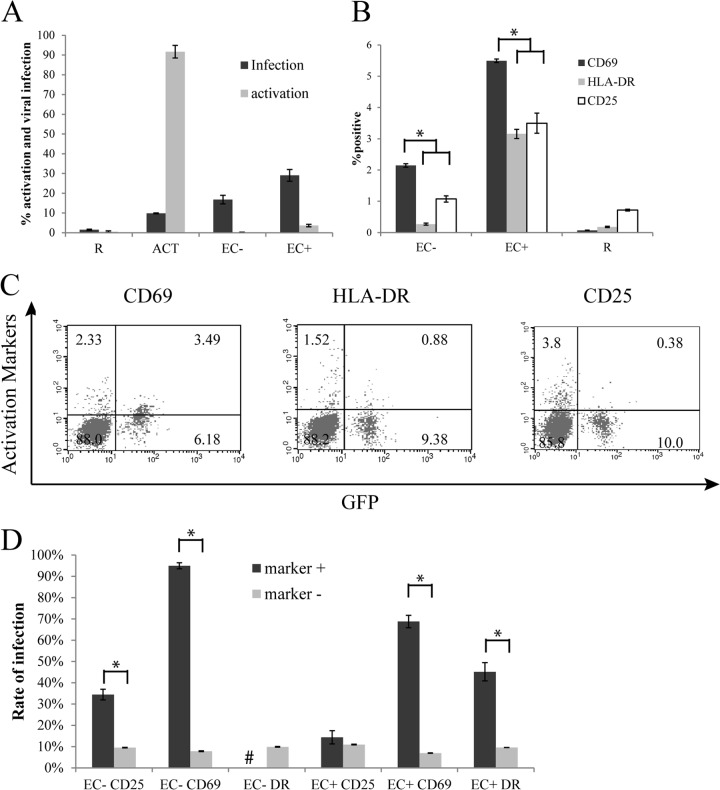
Fig 2.
Infected resting T cells cocultured with EC remained in a resting state. (A) Resting T cells were cultured alone, with EC treated with IFN-γ, with untreated EC, or with CD3/28 activation and infected with a reporter virus expressing GFP. Expressions of GFP as well as activation markers (combined CD69, HLA-DR, or CD25) were measured on day 5 postinfection. (B) In a separate experiment, activation markers CD69, HLA-DR, and CD25 were measured individually on day 10 postinfection. (C) Flow cytometry plots showing both GFP expression and activation markers for EC+ cultures from the same experiment as in panel B. The percentage of cells in each quadrant is indicated. (D) Analysis of infection rates in activation marker-positive cells versus activation marker-negative cells from the same experiment as in panel B. Samples were taken in duplicate (A) or quadruplicate (B and D), and means ± standard errors are plotted, representative of four separate experiments. #, not enough HLA-DR+ cells for analysis. *, P < 0.05, Student t test.

