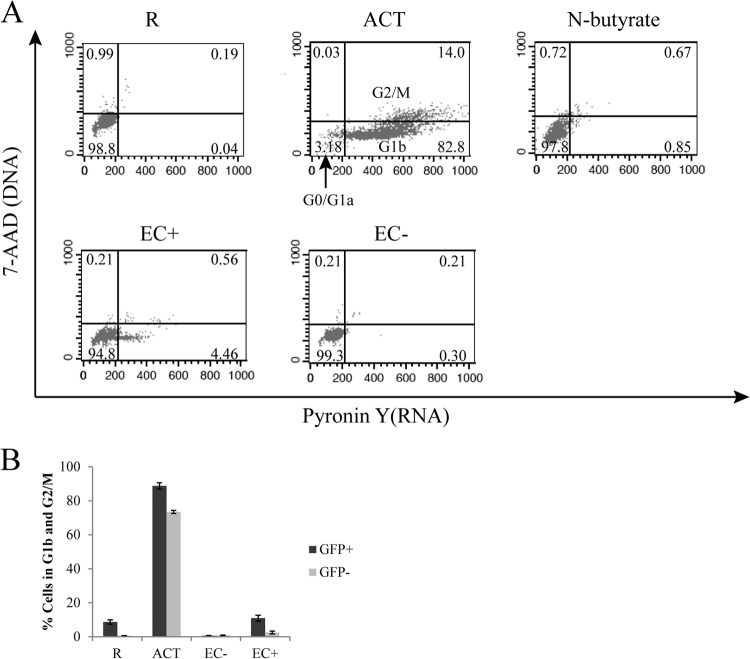
Fig 3.
Cell cycle analysis of CD4+ T cells cultured alone or with EC. (A) Resting T cells were cultured alone, with EC treated with IFN-γ, with untreated EC, or with CD3/28 activation, and on day 6 after coculture, cell cycle analyses were performed by staining for DNA (7-AAD) and RNA (PY). Populations for various cell cycle status and their percentages are indicated on the plots. (B) Resting T cells were cultured alone, with EC treated with IFN-γ, with untreated EC, or with CD3/28 activation and infected with a reporter virus expressing GFP. Five days postinfection, T cells from these various cultures were each sorted into GFP+ and GFP− populations. Cell cycle analyses were then performed on each population from various cultures by staining DNA (7-AAD) and RNA (PY). Panel B shows the means ± standard errors of duplicated samples and is representative of three similar experiments.

