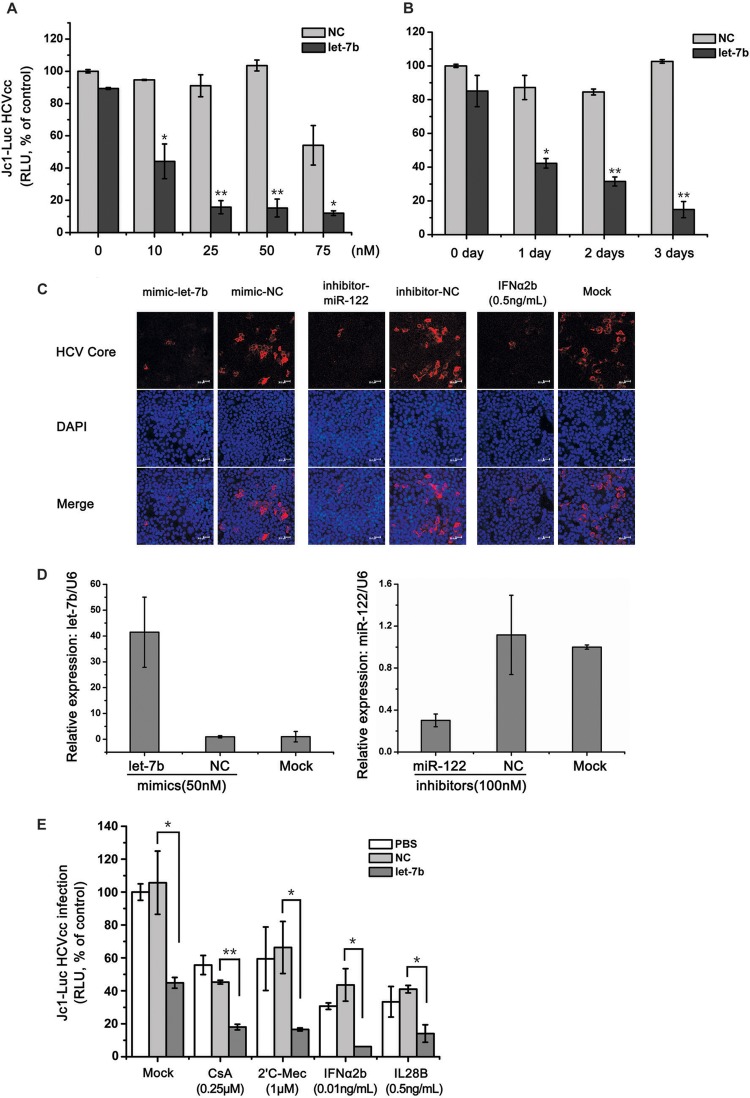
Fig 2.
Characterization of the anti-HCV activity of let-7b. Huh7.5.1 cells were transfected with various concentrations of let-7b mimics and incubated for 2 days (A) or transfected with 50 nM let-7b mimics and incubated for different times (B), followed by infection with Jc1-Luc HCVcc (MOI = 0.1). The infected cells were cultured for an additional 2 days, and the luciferase activity was used to measure HCV propagation. NC, negative control mimics. Statistical analysis was performed to compare the HCV levels in let-7b-transfected and NC cells (*, P < 0.05; **, P < 0.01). (C) Huh7.5.1 cells were transfected with the indicated miRNAs (mimics, 50 nM; inhibitors, 100 nM) and cultured for 2 days, followed by infection with JFH1 HCVcc (MOI = 0.4). Huh7.5.1 cells were challenged with JFH1 HCVcc (MOI = 0.4) 1 day before IFN-α (0.5 ng/ml) treatments. After miRNA transfection or the addition of IFN-α, the cells were cultured for 2 additional days. An miR-122 inhibitor and IFN-α served as the positive controls. Immunofluorescent staining and confocal microscopy were performed using an anti-Core antibody and DAPI. (D) Detection of let-7b or miR-122 expressions in the indicated samples by real-time qRT-PCR was used to confirm the mimic and inhibitor transfections. (E) Huh7.5.1 cells were transfected with 50 nM let-7b mimics or NC mimics. After 2 days, the cells were infected with Jc1-Luc HCVcc (MOI = 0.1) 1 day before administering the indicated drug treatments. The cells were cultured 2 days longer in the presence of drugs, and luciferase activity was measured to assess HCV propagation. Error bars denote the standard deviation from the mean of three independent experiments. Statistical significance was analyzed using Student t test (*, P < 0.05; **, P < 0.01). For ease of comparison, all of the bar graph values were normalized to the mock-transfected control.

