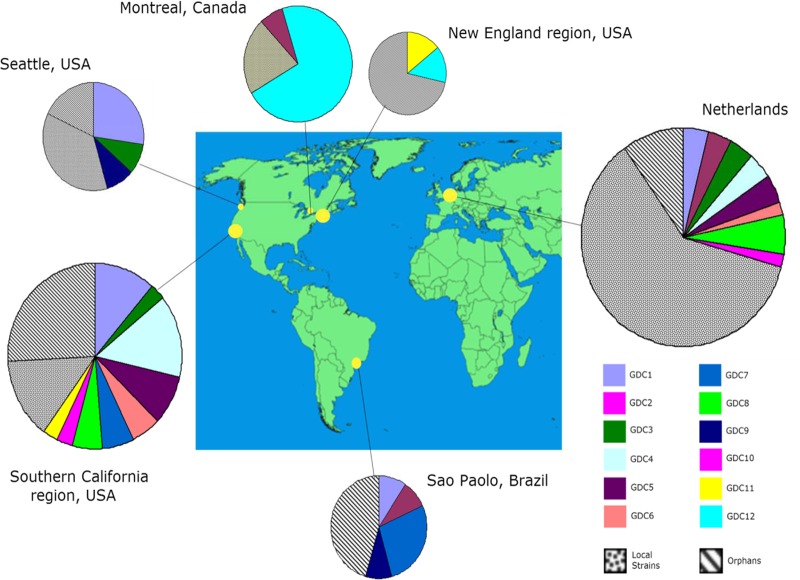
Fig 1.
Geographic distribution of LSP-MVR genotypes of clinical Mycobacterium avium. The size of a pie chart is proportional to the number of cases from each location included in the analysis. Yellow circles on the map correspond to catchment areas of the clinical laboratory(ies) providing isolates or DNA for analysis. GDCs were defined by the same LSP-MVR type being found for at least one clinical isolate at each of two or more geographical locations. LSP-MVR digits of type represent loci HSDR, DA2/LSP2, DA7/LSP7, DEL11/LSPP5, X3, 25, 32, and 47 (21, 39). “1” is used to indicate the absence of the large-sequence polymorphism, which corresponds to product lengths of 343 bp (for HSDR), 834 bp (for DA2/LSP2), 329 bp (for DA7/LSP7), and 728 bp (for DEL11/LSPP5). “2” is used to indicate the presence of the large-sequence polymorphism, which corresponds to product lengths of 480 bp (for HSDR), 954 bp (for DA2/LSP2), 181 bp (for DA7/LSP7), and 794 bp (for DEL11/LSPP5) (21); digits for MIRU-VNTR type represent the number of repeats inferred from the product length at that locus based on product sizes and repeat numbers from Thibault et al. (16) and personal correspondence with V. Thibault: 196 bp when 2 repeats of 53 bp are present (locus X3), 350 bp when 3 repeats of 58 bp are present (25), 298 bp when 8 repeats of 18 bp are present (32), and 217 bp when 3 repeats of 35 bp are present (47). LSP-MVR types of GDCs are as follows: GDC1, 2112-3383; GDC2, 1111-5282; GDC3, 1121-3282; GDC4, 1211-2483; GDC5, 1211-4282; GDC6, 1221-3282; GDC7, 1221-4282; GDC8, 2211-2283; GDC9, 2212-3383; GDC10, 1121-2282; GDC11, 1121-4282; and GDC12, 2112-5383. Local strains were defined by finding the same LSP-MVR type for two or more clinical isolates at a single geographic location but not being found among clinical isolates from other geographic locations; unique types were found for a single isolate in the entire set of clinical genotypes. Environmental isolates are not included in these numbers and were not considered in GDC designations. Genotypes for local clusters and unique types are shown in Table S5 in the supplemental material. The map is adapted from a Wikimedia Commons map (http://commons.wikimedia.org/wiki/File:A_large_blank_world_map_with_oceans_marked_in_blue-edited.png) published under a Creative Commons agreement.

