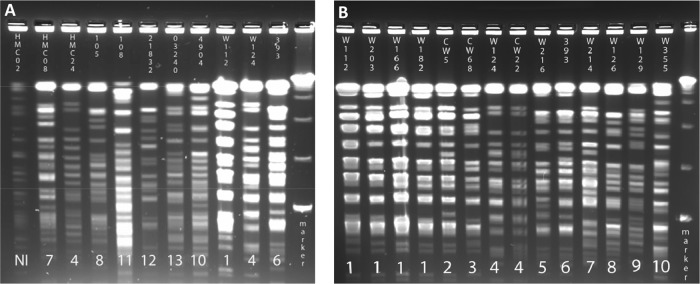
Fig 2.

Pulse-field gel electrophoresis of M. avium clinical isolates. Isolates were selected for this analysis as described in the text. (A) Analysis of 11 isolates, including four from GDC1 and three from GDC7. (B) Analysis of 14 isolates, including one from GDC1 and two from GDC7. Data at the top of each lane indicate the isolate identity. Numbers at the bottom of each lane indicate different PFGE patterns (isolates with the same horizontal number have indistinguishable patterns). DNA markers in the far right lane (from bottom to top) are 48.5, 97.0, 145.5, and 194.0 bp. NI, not interpretable.
