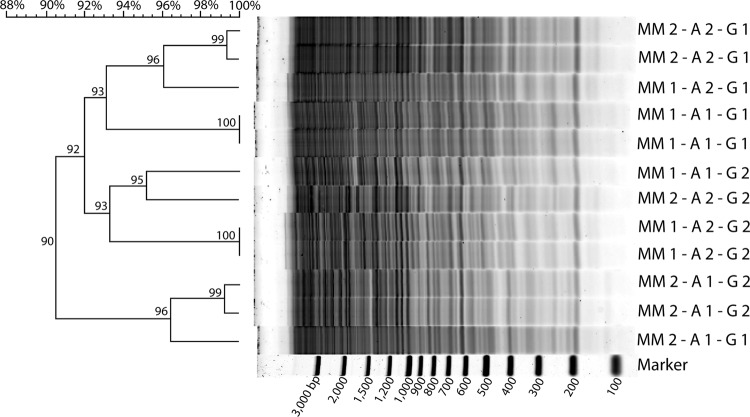
Fig 2.
Reproducibility of RAPD-PCR fingerprints using the HCB-1 decamer against whole viral assemblages from a single Delaware soil sample. The scale at the upper top left is the percent similarity of RAPD-PCR fingerprints. Numbers at the nodes of the dendrogram indicate percent similarity. RAPD-PCR fingerprints were produced from two aliquots (A) each from two different PCR master mixes (MMs). Subsequently, a total of 3 lanes per master mix aliquot were run: 2 lanes on one gel (G) and 1 lane on the other gel. The sizes of marker bands are given as numbers of base pairs of DNA.

