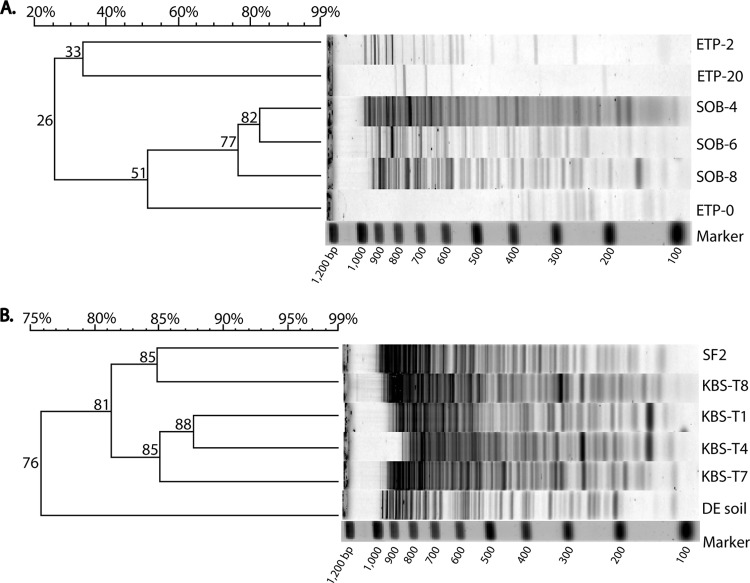
Fig 3.
RAPD-PCR fingerprints of viral communities in soils from Antarctica, Kellogg Biological Station (KBS), and Delaware. (A) RAPD-PCR fingerprints from Antarctic soils (ETP and SOB series). (B) RAPD-PCR fingerprints from KBS soils (T1, T4, T7, T8, and SF2) and Delaware soils (DE soil) under different land use practices. A percent similarity scale is shown at the top left of each panel. Values at the nodes in the dendrogram are percent similarity values for the clusters. Banding patterns with similarity values of ≥89% are considered identical.

