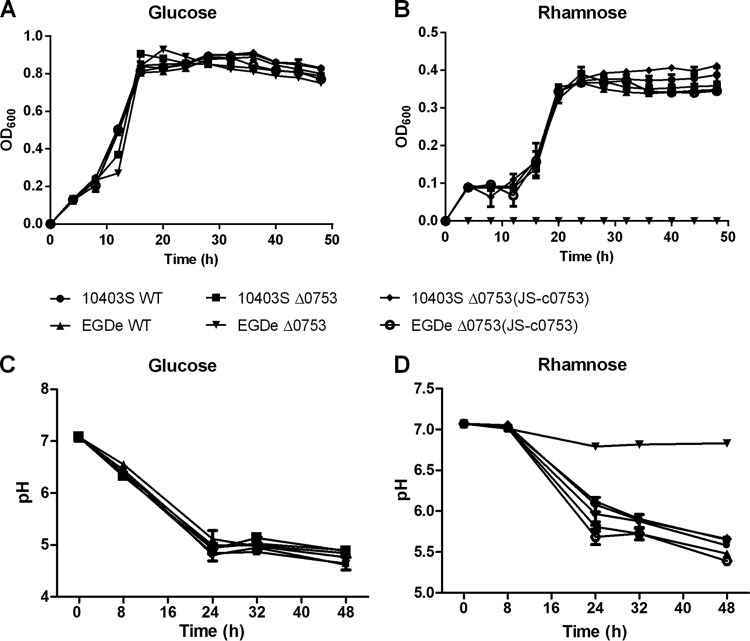
Fig 5.
Phenol red minimal medium growth curves and pH carbohydrate assays of L. monocytogenes strains. The growth curves were constructed using either glucose (A) or l-rhamnose (B) as the sole carbon source. pH carbohydrate assays were conducted with either glucose (C) or l-rhamnose (D) as the sole carbon source. The error bars represent standard deviations of three independent experiments conducted with quadruplicate samples.

