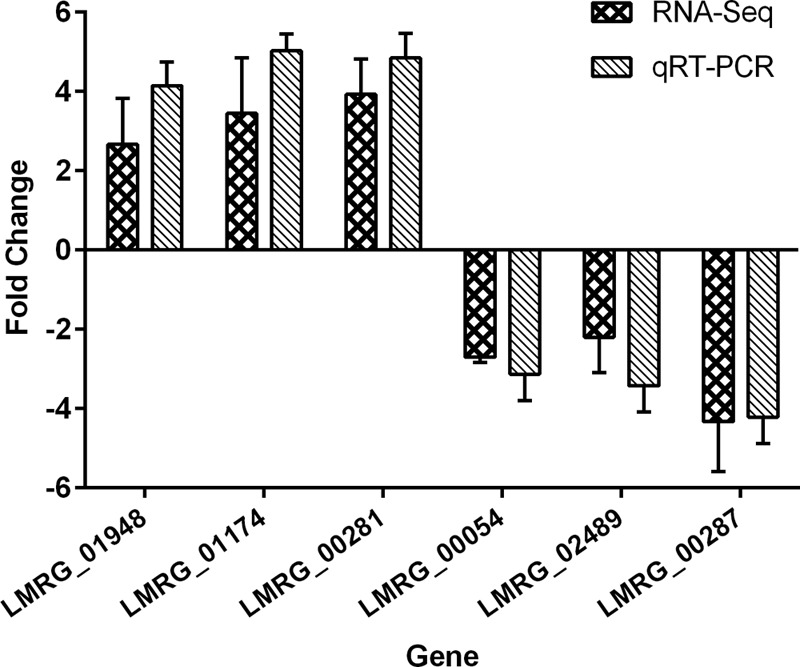
Fig 6.

Comparison of gene expression fold changes identified by RNA-seq and qRT-PCR analyses. Six genes (3 upregulated and 3 downregulated) were compared. Fold changes were converted to log2 values for comparison. 16S rRNA (LMRG_05501) was used as an internal reference. The error bars represent standard deviations of three independent experiments conducted with quadruplicate samples.
