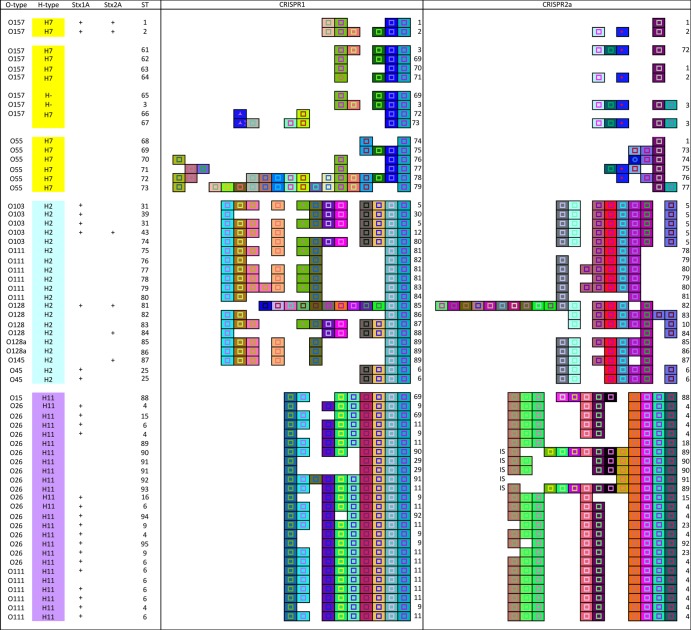
Fig 4.
CRISPR1 and CRISPR2a alleles of E. coli H7, H2, and H11 strains. Strain name, O type, H type, and ST are shown in their respective columns. stx1A and stx2A types are indicated if the information was available. CRISPR1 and -2a alleles are presented in their respective columns, with the allele numbers to the right. Each unique spacer is represented by a unique color combination of the center shape and background. The shape in the center indicates the spacer length ( = 32 bp,
  = 33 bp, ⧫ = 30 bp,
  = 28 bp,
  = 26 bp). “IS” represents an insertion sequence.

