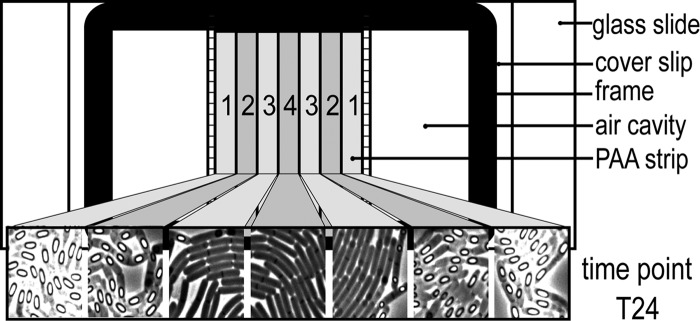
Fig 2.

Cellular development depending on the position of the cells on the time-lapse microscopy slide. A schematic representation of the polyacrylamide (PAA) strip is divided into seven equal sections (given numbers 1 through 4). Pictures of cells taken from each of these sections show clear differences in sporulation efficiency depending on the distance of the cells relative to the periphery of the PAA slice (pictures were taken 24 h after the start of the time-lapse experiment).
