
Fig 3.
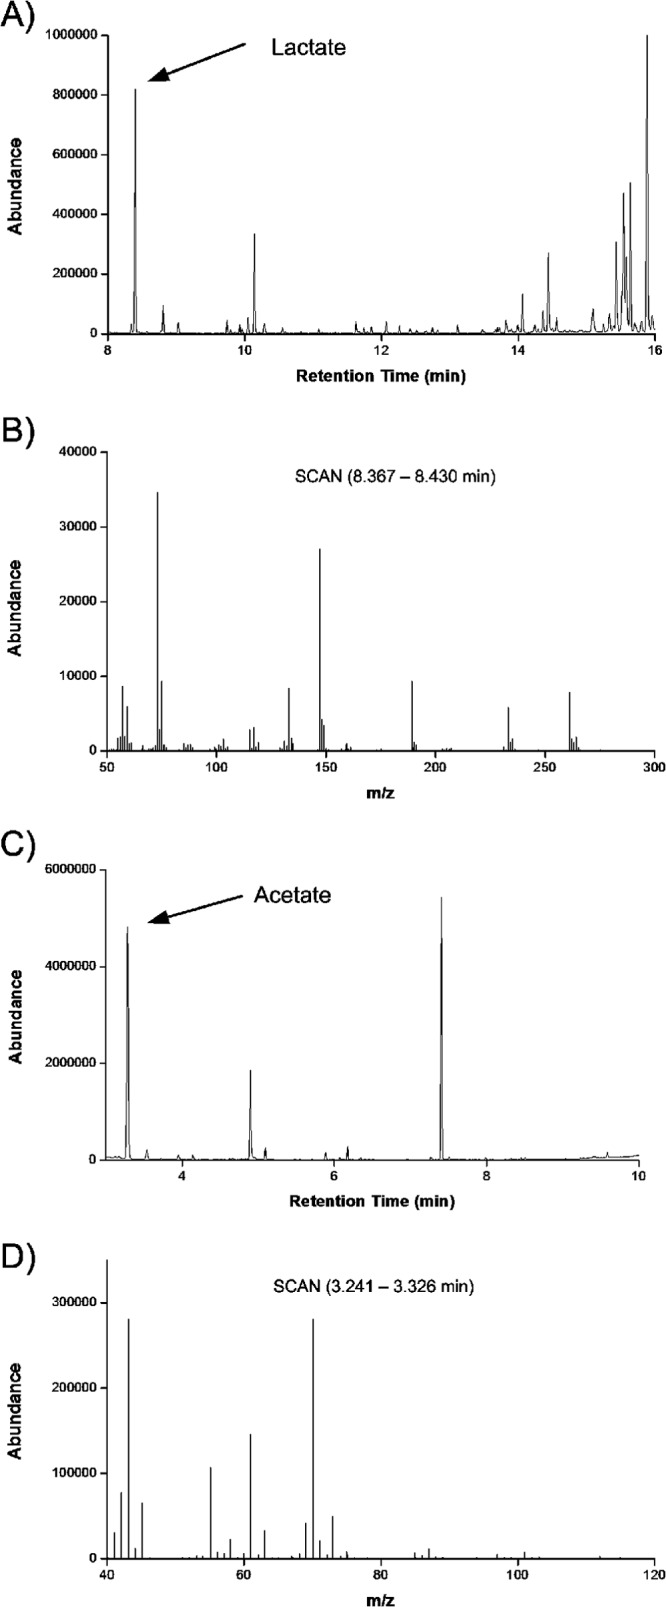
GC/MS analysis of 13C patterns of lactate and acetate in culture supernatant. (A) Total ion current of the sample after derivatization with N-methyl-N-t-butyldimethylsilyl-trifluoroacetamide (MBDSTFA), with lactate eluting after 8.35 min; (B) corresponding mass spectrum of TBDMS2-lactate; (C) total ion current of the sample after derivatization with N-pentanol, with acetate eluting after 3.25 min; (D) corresponding mass spectrum of acetic acid (pentyl ester).