
Fig 3.
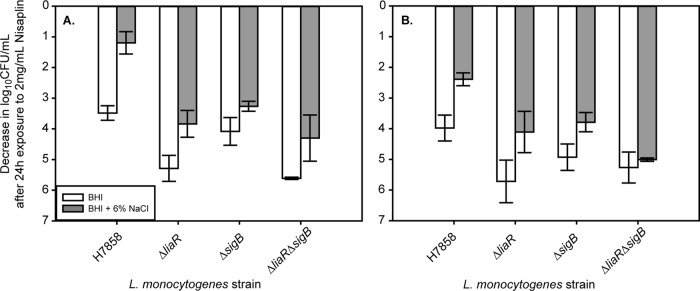
Log decrease in cell density for exponential-phase (A) or stationary-phase (B) cells of H7858 and isogenic ΔliaR, ΔsigB, and ΔliaR ΔsigB mutants exposed to 2 mg/ml Nisaplin in BHI for 24 h at 7°C. The average and standard deviation for three independent replicates are plotted for each strain. White bars represent cultures that were exposed only to BHI prior to exposure to Nisaplin, and gray bars represent cultures that were first exposed to BHI plus 6% NaCl before exposure to Nisaplin.