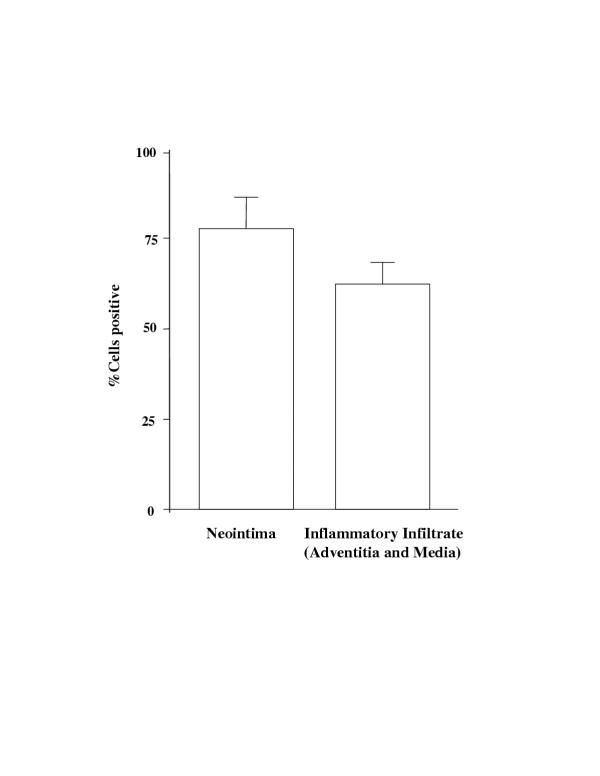
Figure 8.
Morphometric analysis of PCNA positive staining. Both neointima and adventitia/media were analyzed by averaging cell numbers from three selected high power view fields (objective magnification 40X). Data were collected from three individual animals and are expressed as % positive cells ± SD.

