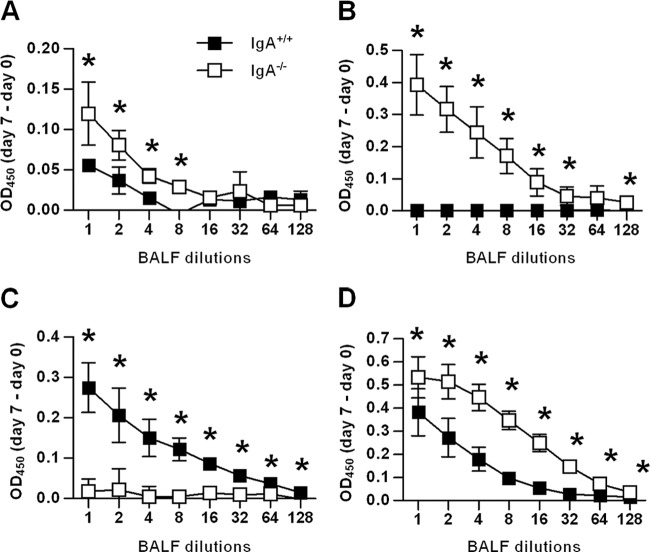
Fig 4.
Anti-LVS antibody levels in BALF samples after i.n. F. tularensis LVS infection of IgA−/− and IgA+/+ mice. F. tularensis LVS-specific total (A), IgM (B), IgA (C), and IgG (D) antibody were measured by ELISA on day 7 postinfection. Each symbol represents the mean of four or five mice per group ± SD. Values that are statistically significantly different (P < 0.05) are indicated by an asterisk. Optical densities at 450 nm (OD450) were subtracted from those of BALF samples from naive mice.

