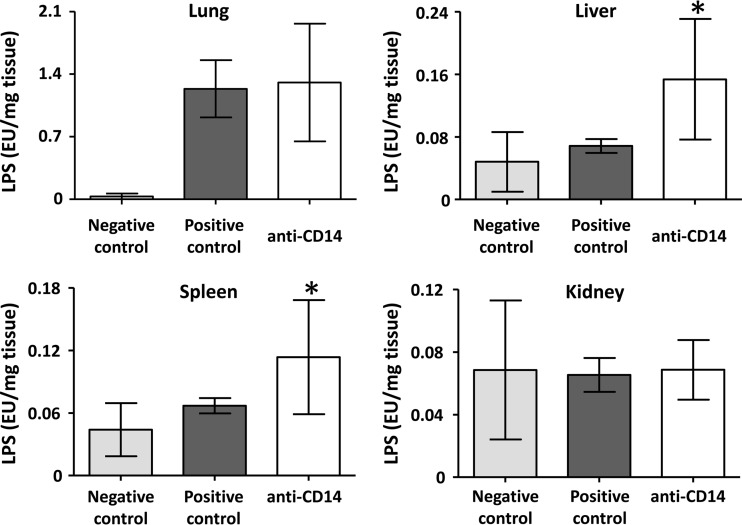
Fig 2.
Effect of anti-CD14 on LPS load in the organs. The LPS loads in the organs in the negative control group, in the positive control group, and in the anti-CD14 group are shown for various organs. The anti-CD14 group is statistically compared to the positive control group. The data are presented as means and 95% confidence intervals. *, P < 0.05.

