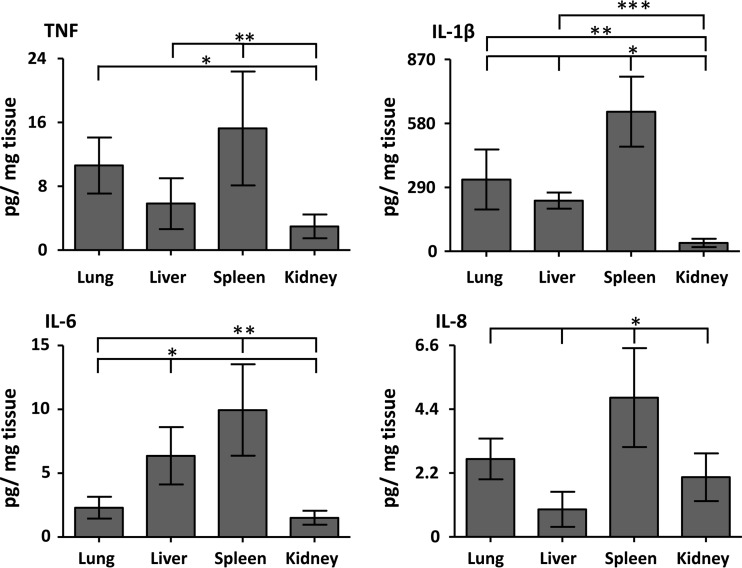
Fig 3.
Cytokine load in the organs. The organ load of the proinflammatory cytokines TNF, IL-1β, IL-6, and IL-8 in the organs in the positive control group is shown in the E. coli group. The data are presented as means and 95% confidence intervals. TNF: *, lung versus kidney; **, spleen versus liver and kidney. IL-1β: *, spleen versus lung, liver, and kidney; **, lung versus kidney; ***, liver versus kidney. IL-6: *, liver versus lung and kidney; **, spleen versus lung and kidney. IL-8: *, spleen versus lung, liver, and kidney. All, P < 0.05.

