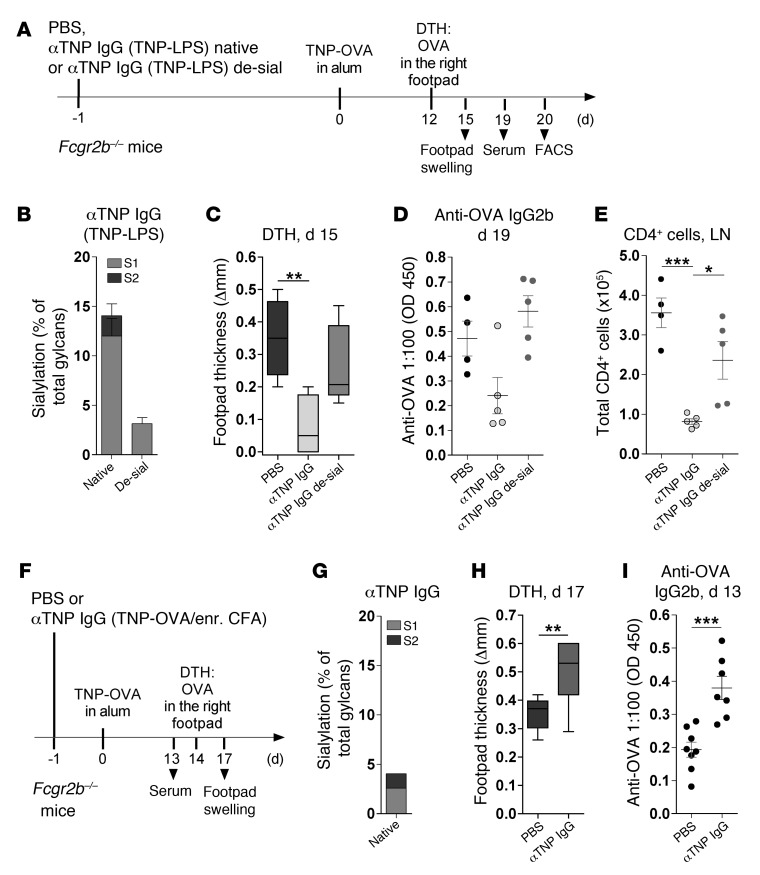
Figure 4. Transfer of antigen-specific sialylated, but not desialylated, TI IgGs suppresses a subsequent antigen-induced DTH response.
(A) Experimental approach for B–E. Fcgr2b–/– mice were injected i.v. on day –1 with PBS (n = 4) or 200 μg native (n = 5) or sialidase-treated desialylated (de-sial; n = 5) anti-TNP IgG Abs purified from the pooled sera of TNP-LPS–immunized WT mice. DTH was induced as in Figure 1. (B) Frequency of Fc sialic acid modifications on native or sialidase-treated TNP-reactive IgGs, determined by EndoS treatment and MALDI-TOF MS (Supplemental Figure 4). Bars represent mean + SEM. (C) Difference in footpad thickness between the right and left footpad at day 15. (D) Anti-OVA IgG2b Ab levels, determined via ELISA. (E) Mice were sacrificed, and draining LNs were analyzed for total CD4+ cell numbers. 1 representative of 2 independent experiments is shown. (F) Experimental approach for G–I. Fcgr2b–/– mice were injected i.v. with PBS (n = 8) or 200 μg anti-TNP IgGs purified from the pooled sera of TNP-OVA in enriched CFA–immunized WT mice (n = 7). DTH was induced as in Figure 1. (G) Frequency of Fc sialic acid modifications on native TNP-specific IgGs, (H) differences in footpad thickness, and (I) anti-OVA IgG2b levels, determined as described above. 1 representative of 2 independent experiments is shown. (C and H) Box-and-whisker diagrams show median and sample minimum and maximum. (D, E, and I) Symbols represent data from individual animals. Horizontal lines represent mean + SEM. *P < 0.05, **P < 0.01, ***P < 0.001.

