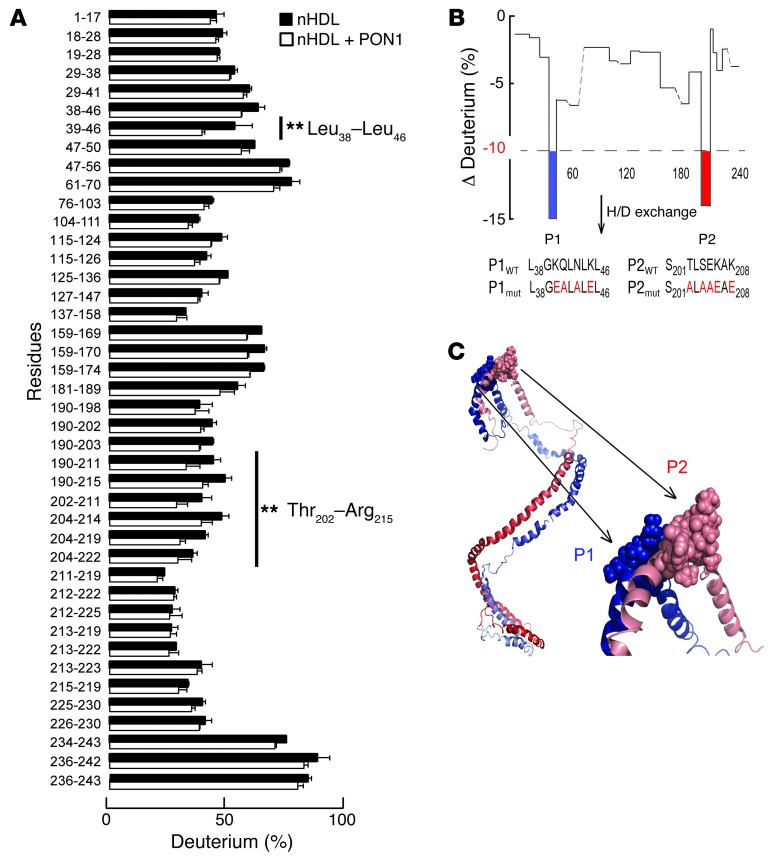
Figure 3. PON1 interaction sites on APOA1 within nHDL revealed by HDX MS.
(A) Plot indicating the percentage of deuterium incorporation of exchangeable protons within individual peptic peptides of APOA1 in nHDL in the absence (black bars) versus presence (white bars) of PON1. **P < 0.05. (B) Plot showing percentage change in deuterium incorporation of individual peptic peptides of APOA1 in nHDL in the absence or presence of PON1. Two regions of APOA1 demonstrate a significant reduction in deuterium incorporation in the presence or absence of PON1/P1 (L38GKQLNLKL46) and P2 (S201TLSEKAK208). Dotted line marks the 10% reduction in deuterium incorporation. (C) Illustration of PON1 interaction domains P1 and P2 on APOA1 within the double superhelix model of nHDL. The two APOA1 molecules are aligned in a head-to-tail antiparallel arrangement using a helix 5/helix 5 registry. N-termini are shown in dark red/blue, and C-termini are shown in light red/blue. PON1 interaction sites on nHDL (P1, blue; P2, light red).

