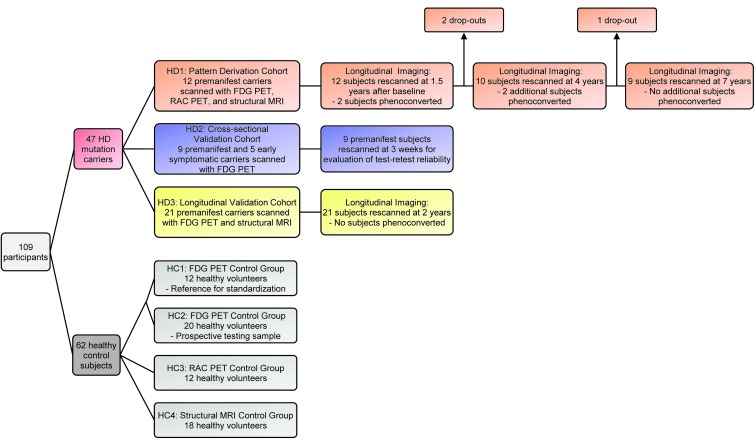
Figure 1. Flow diagram illustrating the design of the study.
109 participants (47 HD gene carriers and 62 age-matched healthy control [HC] subjects) were enrolled. A metabolic progression pattern was identified from the FDG PET scans obtained in a longitudinal cohort (HD1) comprising 12 premanifest HD carriers. Pattern expression was prospectively validated in a crosssectional validation cohort (HD2) comprising 9 premanifest carriers (for the evaluation of test-retest reliability) and 5 early-stage symptomatic HD subjects. The rate of network progression was validated in an independent longitudinal cohort (HD3) comprising 21 premanifest carriers. Metabolic network values were computed in a control group (HC1) comprising 12 healthy subjects and were used to standardize pattern expression in each subject. A second control group (HC2) comprising 20 healthy subjects was used to prospectively evaluate pattern expression in gene-negative individuals. A volume-loss progression pattern was identified in the structural MRI scans obtained in the longitudinal HD1 subjects. Progression rates for this pattern were assessed in both the HD1 and HD3 longitudinal cohorts. Individual scores of the volume-loss pattern were standardized with reference to values computed from a control group (HC4) comprising 18 healthy subjects. In the longitudinal HD1 cohort, the rates of network progression were compared with analogous regional measurements obtained in the caudate and putamen with [11C]-raclopride (RAC) PET (D2 receptor binding) and structural MRI (tissue volume). These regional values were standardized with reference to the corresponding HC3 (comprising 12 healthy subjects) and HC4 control groups.

