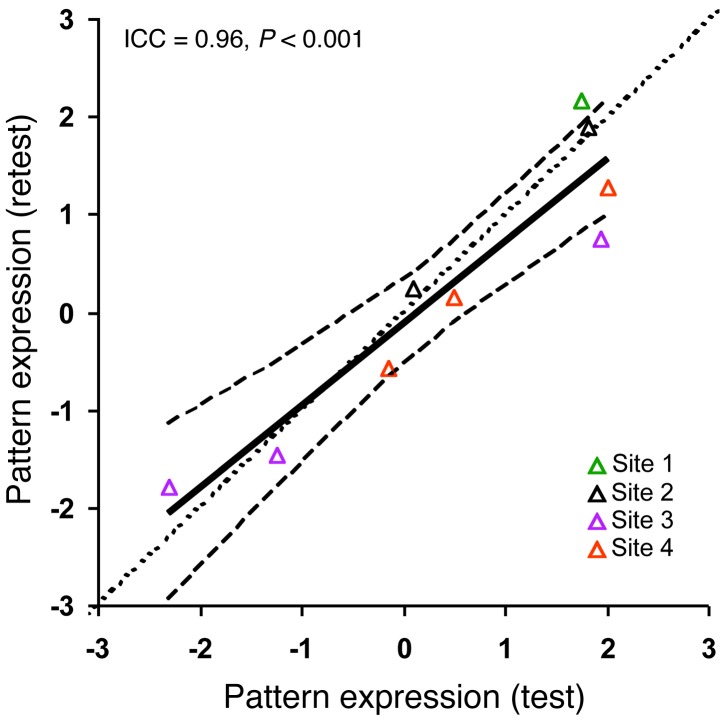
Figure 3. Measurements of the HD metabolic progression pattern expression: test-retest reproducibility.
Test-retest reproducibility was excellent (intraclass correlation coefficient [ICC] = 0.96, P < 0.001) for metabolic pattern expression values computed prospectively in the 9 premanifest HD2 subjects who underwent repeat FDG PET studies at 4 imaging sites as part of the PREDICT-HD consortium. The line of identity (dotted line) falls within the 95% CI (broken curves) of the test-retest regression line (solid line). Data from the 4 imaging laboratories that participated in the test-retest study are signified by color. Site 1: North Shore University Hospital (n = 1); site 2: Indiana University (n = 2); site 3: University of Iowa (n = 3); site 4: University of Toronto (n = 3).

