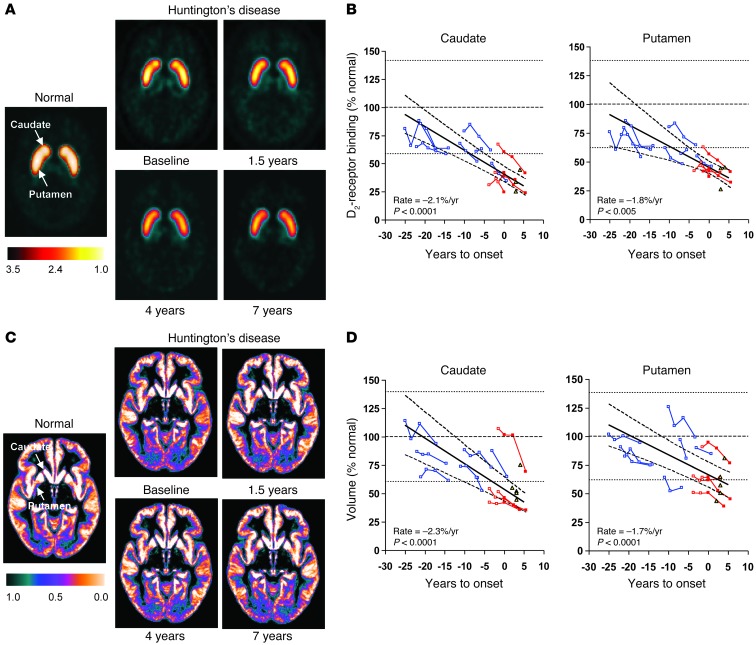
Figure 7. Longitudinal changes in striatal D2 receptor binding and tissue volume.
(A) Composite [11C]-raclopride PET images from healthy control subjects (left) and premanifest HD carriers (right) scanned at baseline, 1.5, 4, and 7 years. In each image, dopamine D2 receptor binding was computed voxel-wise as (voxel/occipital-1) and displayed in standard space. The display was thresholded from 1.0 to 3.5. (B) Caudate (left) and putamen (right) D2 receptor–binding values measured using [11C]-raclopride PET exhibited a linear decrease with advancing disease (–2.1% and –1.8% of normal mean per year, P < 0.005; IGM); the decline in the caudate was faster than for the putamen (P < 0.002). (C) Gray matter tissue probability maps from healthy control subjects (left) and the premanifest HD carriers described above (right). Each map represents the average of the gray matter–segmented MRI scans from each group/time point. The display was thresholded from 0.0 to 1.0. (D) Caudate (left) and putamen (right) MRI-based tissue volume measurements also declined linearly with advancing disease (–2.3% and –1.7% of the normal mean per year, P < 0.0001; IGM). Progression rates did not differ for the 2 regions (P = 0.27). In B and D, individual values are represented as percentage of the mean (broken line) for an age-matched healthy control group; the dotted lines represent 2 SD above and below the normal mean. The data from the phenoconverters and nonphenoconverters in the longitudinal HD1 cohort are presented by red and blue lines, respectively. Caudate and putamen values for the symptomatic HD2 subjects (yellow triangles) are provided for reference.

