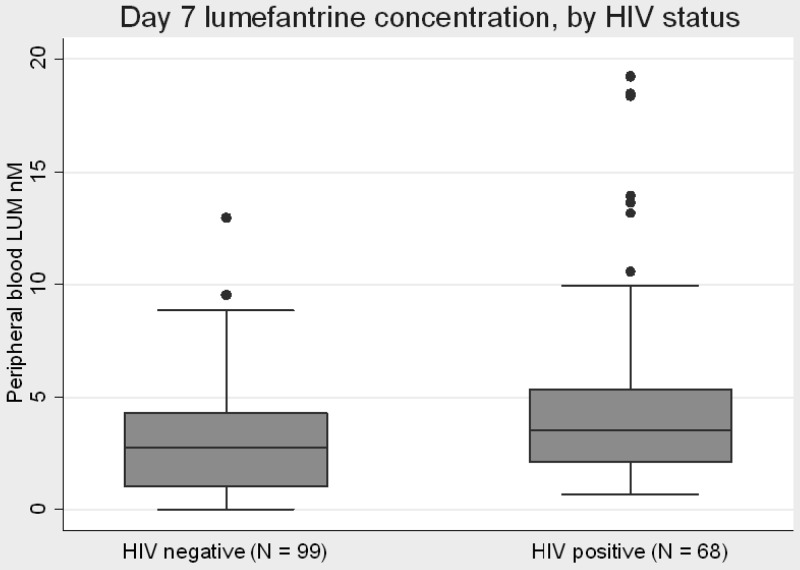
Fig 1.
Day 7 lumefantrine concentration in AL-treated participants. Midline of each box plot is the median, with the edges of the box representing the interquartile interval. Whiskers delineate the 5th and 95th percentiles. Lumefantrine concentration was below the normal limits of detection in five individuals, all in the HIV-negative group (see the text).

