Fig 1.
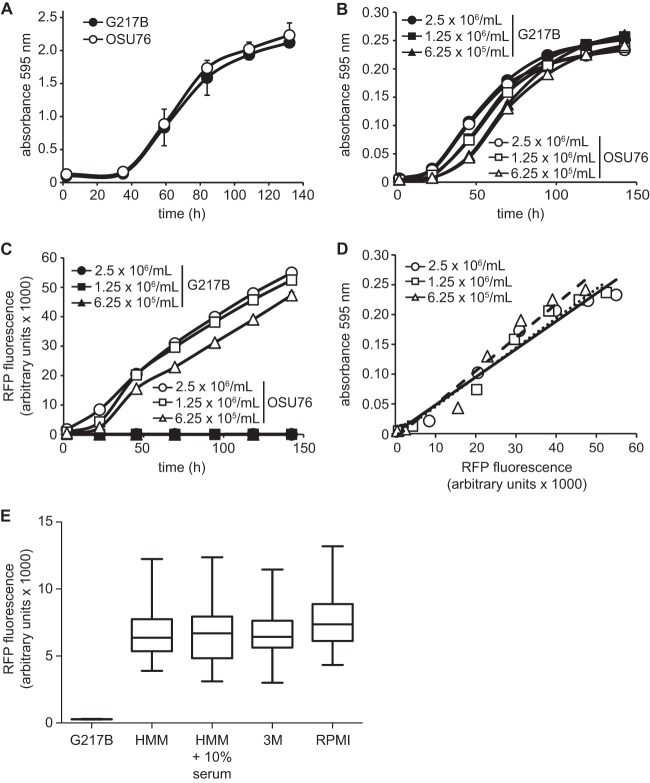
Development of a fluorescence microtiter plate-based assay to monitor Histoplasma yeast growth. (A) Histoplasma G217B and OSU76 yeast growth in flasks. Growth was monitored over time by measurements of culture turbidity (absorbance at 595 nm). (B to D) Histoplasma yeast growth in microtiter plates. (B and C) Yeast cells were added to 96-well microtiter plates in a volume of 100 μl at 2.5 × 10⁶, 1.25 × 10⁶, or 6.25 × 10⁵ yeast cells per ml, and growth was monitored daily by measuring the absorbance at 595 nm (B) or RFP fluorescence (C). (D) Correlation of Histoplasma yeast growth measured by RFP with growth determined by the absorbance at 595 nm. Data points represent 2.5 × 10⁶, 1.25 × 10⁶, or 6.25 × 10⁵ yeast cells per ml, and a line of best fit shows correlation between the measurement methods (R2 = 0.96, 0.96, and 0.97, respectively). (E) Distribution of RFP fluorescence of individual OSU76 yeast cells. Fluorescence of yeasts was measured by microscopy following growth in HMM, HMM plus 10% serum, 3M minimal medium, or RPMI-based medium. Data represent the means (horizontal bars) ± standard deviations (boxes) and ranges (vertical lines; n = 100) of RFP-fluorescent yeast cells (OSU76) compared to RFP-negative yeast cells (G217B).

