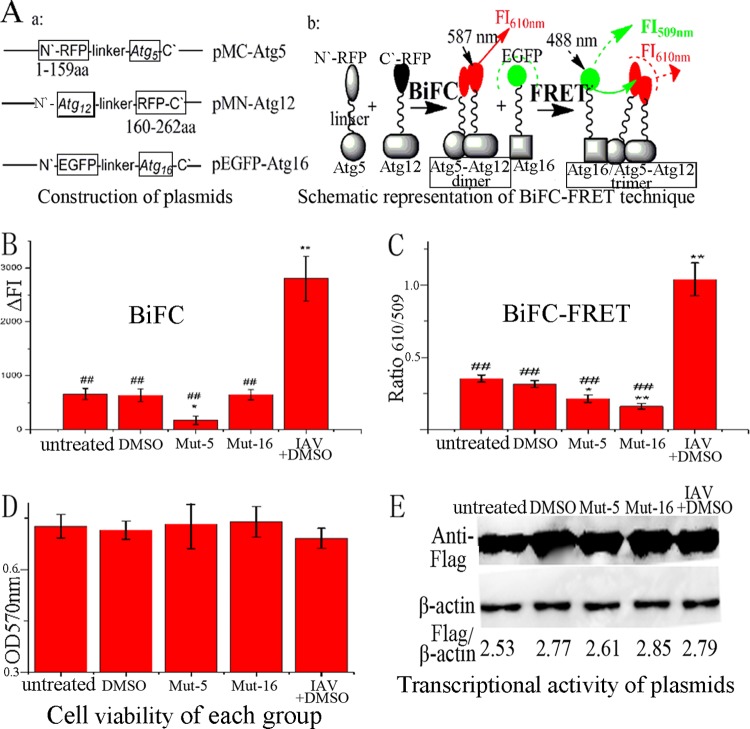
Fig 1.
Design of our drug-screening model. (A) Construction of plasmids and schematic representation of the BiFC-FRET technique. The human Atg5 and Atg12 genes were fused to the N and C fragments, respectively, of a red fluorescent protein (mCherry). Atg16 was fused to EGFP. After cotransfection, the BiFC reaction took place between the Atg5 and Atg12 fusion proteins, and the FI was measured at 610 nm after excitation at 587 nm; subsequently, the FRET reaction took place between the Atg5-Atg12 heterodimer and the Atg16 fusion protein, and the FI was measured at 509 and 610 nm after excitation at 488 nm, and BiFC-FRETe was expressed as the ratio of ΔFI610 to ΔFI509. (B) Influences of 0.5% DMSO, mut-Atg5, mut-Atg16, and IAV infection (MOI = 2.0; infection time, 8 h) on the BiFC reaction between the Atg5 and Atg12 fusion proteins. (C) Influences of DMSO, mut-Atg5, mut-Atg16, and IAV infection on the BiFC-FRET reaction between the Atg5-Atg12 heterodimer and the Atg16 fusion protein. (D) Influences of DMSO, mut-Atg5, mut-Atg16, and IAV infection on cell viability, as determined by the MTT method. (E) Influences of DMSO, mut-Atg5, mut-Atg16, and IAV infection on the transcriptional activity of the plasmids determined by Western blotting using anti-Flag antibody. After cotransfection for 6 h, only the IAV-plus-DMSO group was infected with IAV, and each group was incubated for another 8 h. The zones and average gray values of each band were detected and quantified with BandScan 5.0 software. The multiplication product of the zone area and the average gray value was calculated, and the results are expressed as the ratio of Flag to β-actin. The data are expressed as the means ± SD of two independent experiments with three replicates each. *, P < 0.05, and **, P < 0.01 versus the untreated group; ##, P < 0.01 versus the IAV-plus-DMSO group.

