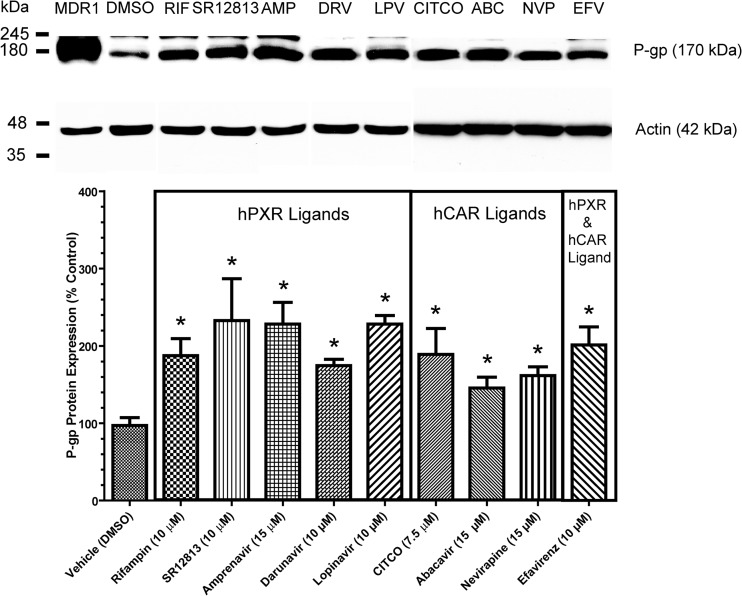
Fig 3.
P-gp immunoblotting and densitometric analysis. Shown is P-gp expression normalized to the vehicle control (DMSO) in hCMEC/D3 cells after 72 h of treatment with (i) the hPXR ligands rifampin (10 μM; hPXR agonist), SR12813 (10 μM; potent hPXR agonist), amprenavir (15 μM; HIV PI), darunavir (10 μM; HIV PI), and lopinavir (10 μM; HIV PI); (ii) the hCAR ligands CITCO (7.5 μM; synthetic potent hCAR agonist), abacavir (15 μM; NRTI), and nevirapine (15 μM; NNRTI); or (iii) the dual hPXR and hCAR ligand efavirenz (10 μM; NNRTI). A representative immunoblot assay of P-gp expression is shown at the top. Whole-cell lysates prepared from a P-gp-overexpressing human breast carcinoma cell culture system (MDA-MDR1, 2 μg) served as a P-gp positive control. A 50-μg load of whole-cell lysate of hCMEC/D3 cells was resolved by 10% SDS-PAGE and subsequently transferred to a PVDF membrane. Densitometric analysis was performed to determine relative P-gp expression. P-gp was detected with the monoclonal antibody C219 (1:500) and an anti-mouse secondary antibody (1:3,000). Data represent n-fold percentage changes normalized to the vehicle control and are means ± SDs obtained from three experiments from cells of different passages. Statistically significant differences from the control in P-gp expression, as determined by one-way ANOVA with Dunnett's post hoc t test at a significance level of P < 0.05, are indicated (*).

