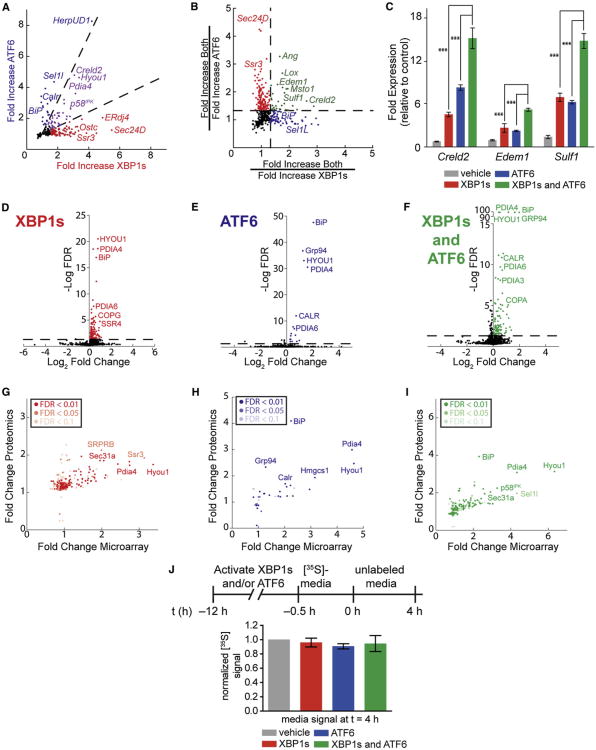
Figure 2. Transcriptional and Proteomic Profiling of Stress-Independent XBP1s and/or ATF6 Activation in HEK293DAX Cells.
Data derived from Affymetrix whole-genome arrays and SILAC-MuDPIT whole-cell proteomic analyses of HEK293DAX cells following a 12 hr activation of XBP1s (dox; 1 μg/ml), DHFR.ATF6 (TMP; 10 μM), or both. Only genes with a FDR <0.05 are described (n = 3), unless otherwise indicated.
(A) Plot depicting mRNA fold increase owing to XBP1s activation versus ATF6 activation. Dashed lines indicate a 1.9-fold filter to assign genes as selectively induced by XBP1s (red), ATF6 (blue), or lacking selectivity (purple). Only genes upregulated ≥1.5-fold are colored.
(B) Plot depicting a ratio-of-ratios comparison to identify genes cooperatively induced by XBP1s and ATF6. Genes colored green are cooperatively induced ≥1.33-fold by the combined activation of XBP1s and ATF6 relative to activating either transcription factor individually.
(C) qPCR analysis validating select genes cooperatively upregulated by the combination of XBP1s and ATF6 in HEK293DAX cells. qPCR data are reported relative to vehicle-treated HEK293DAX cells. Error bars indicate SE from biological replicates (n = 3). ***p < 0.005.
(D–F) Plots of log2 fold change versus log FDR for all proteins identified in our SILAC-MuDPIT analysis following activation of (D) XBP1s, (E) ATF6, or (F) both. FDRs in (D) and (E) were calculated from ANOVA p values. FDRs in (F) were calculated using p values from t test distributions.
(G–I) Plots of fold change in microarray experiments versus fold change in proteomics experiments for HEK293DAX cells following activation of (G) XBP1s, (H) ATF6, or (I) both. In each panel, the significance of the SILAC-MuDPIT quantification is indicated by shading.
(J) Quantification of autoradiograms of media from HEK293DAX cells collected after a 4 hr chase in nonradioactive media. The metabolic-labeling protocol employed is shown. Error bars represent SE from biological replicates (n = 3).
See also Tables S1 and S3.

