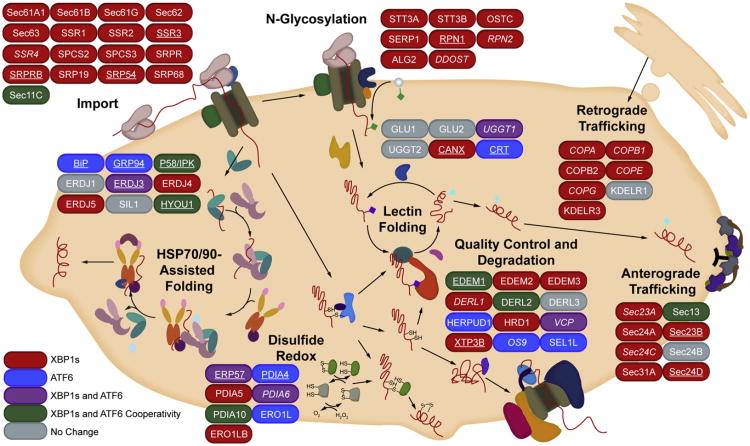
Figure 3. Predictive Pathway Analysis for Stress-Independent XBP1s- and/or ATF6-Mediated Remodeling of the ER Proteostasis Network.
Cartoon depicting the impact of activating XBP1s, ATF6, or both XBP1s and ATF6 on the composition of ER proteostasis pathways obtained by integrating transcriptional, proteomic, and biochemical results. XBP1s (red) and ATF6 (blue)-selective genes are genes where activating either XBP1s (but not ATF6) or ATF6 (but not XBP1s) independently results in >75% of the induction observed when both XBP1s and ATF6 are activated (“max induction”). Genes induced >75% of the max induction by activating XBP1s in isolation and induced >75% of the max induction by activating ATF6 in isolation (i.e., lacking selectivity) are colored purple. Genes cooperatively induced >1.33-fold upon activation of both XBP1s and ATF6 relative to the activation of either transcription factor alone are colored green. Plain type indicates results from array data. Italicized type indicates results from proteomics data. Underlined type indicates results confirmed at both the transcript and the protein levels. Thresholds for transcriptional analyses were set at a FDR of <0.05. Thresholds for proteomic analyses were set at a FDR of 0.1.

