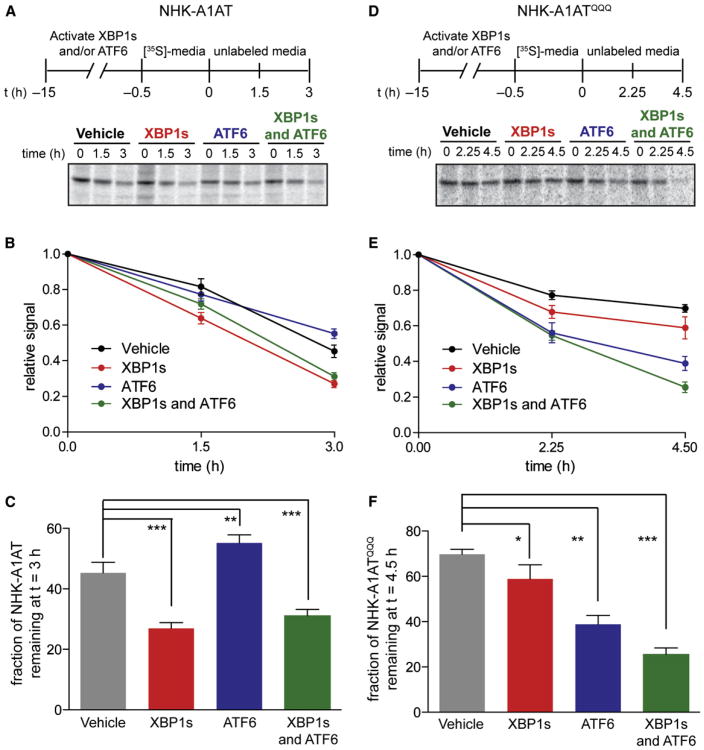
Figure 4. XBP1s and/or ATF6 Activation Differentially Influences the Degradation of NHK-A1AT and NHK-A1ATQQQ.
(A) Representative autoradiogram of [35S]-labeled NHK-A1AT immunopurified from transfected HEK293DAX cells following a 15 hr preactivation of XBP1s (dox; 1 μg/ml), DHFR.ATF6 (TMP; 10 μM), or both. The metabolic-labeling protocol employed is shown.
(B) Quantification of autoradiograms in (A) monitoring the degradation of [35S]-labeled NHK-A1AT. The fraction of NHK-A1AT remaining was calculated by normalizing the recovered [35S] signal to the total amount of labeling observed at 0 hr. Error bars represent SE from biological replicates (n = 18).
(C) Bar graph depicting the normalized fraction of NHK-A1AT remaining at 3 hr calculated as in (B).
(D) Representative autoradiogram of [35S]-labeled NHK-A1ATQQQ immunopurified from transfected HEK293DAX cells following a 15 hr preactivation of XBP1s (dox; 1 μg/ml), DHFR.ATF6 (TMP; 10 μM), or both. The metabolic-labeling protocol employed is shown.
(E) Quantification of autoradiograms in (D) monitoring the degradation of [35S]-labeled NHK-A1ATQQQ. The fraction of NHK-A1ATQQQ remaining was calculated as in (B). Error bars represent SE from biological replicates (n = 6).
(F) Bar graph depicting the normalized fraction of NHK-A1ATQQQ remaining at 4.5 hr calculated as in (B).
*p < 0.05, **p < 0.01, and ***p < 0.001. See also Figure S3.

