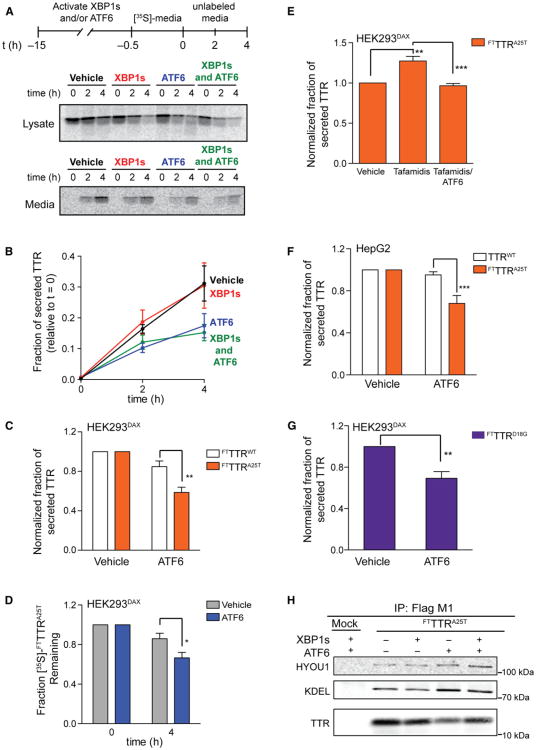
Figure 5. ATF6 Activation Selectively Attenuates the Secretion of Amyloidogenic TTR.
(A) Autoradiogram of [35S]-labeled FTTTRA25T immunopurified from media and lysates collected from transfected HEK293DAX cells following a 15 hr preactivation of XBP1s (dox; 1 μg/ml), DHFR.ATF6 (TMP; 10 μM), or both. The metabolic-labeling protocol employed is shown.
(B) Quantification of autoradiograms as shown in (A). Fraction secreted was calculated as previously described by Sekijima et al. (2005). Error bars represent SE from biological replicates (n = 4).
(C) Graph depicting the normalized fraction secreted of [35S]-labeled FTTTRWT (white bars) or FTTTRA25T (orange bars) at 4 hr following a 15 hr preactivation of DHFR.ATF6 (TMP; 10 μM) in HEK293DAX cells. Error bars represent SE from biological replicates (n = 8 for FTTTRA25T, and n = 9 for FTTTRWT).
(D) Graph depicting the total [35S]-labeled FTTTRA25T remaining in HEK293DAX cells (combined media and lysate protein levels as in A). The fraction remaining was calculated as reported previously by Sekijima et al. (2005). Error bars represent SE from biological replicates (n = 8).
(E) Graph depicting the normalized fraction secreted of [35S]-labeled FTTTRA25T (orange bars) at 4 hr following preactivation of DHFR.ATF6 (TMP; 10 μM; 15 hr) inthe presence or absence of tafamidis (10 μM; 15 hr) in HEK293DAX cells. Error bars represent SE from biological replicates (n = 4).
(F) Bar graph depicting the normalized fraction secreted of FTTTRA25T and endogenous TTRWT at 4 hr following a 13 hr pretreatment with TMP (100 μM) in HepG2 cells stably expressing DHFR.ATF6. Error bars represent SE from biological replicates (n = 4).
(G) Bar graph depicting the normalized fraction secreted of [35S]-labeled FTTTRD18G at 4 hr following a 15 hr pretreatment with TMP (10 μM) from HEK293DAX cellstransfected with both FTTTRD18G and TTRWT. Error bars represent SE from biological replicates (n = 4).
(H) Immunoblot of α-FLAG M1FTTTRA25T immunoisolations from DSP-crosslinked lysates prepared from HEK293DAX cells expressing FTTTRA25T following 15 hr activation of XBP1s (dox; 1 μg/ml), DHFR.ATF6 (TMP; 10 μM), or both. HEK293DAX cells expressing GFP are shown as a negative control (Mock). The KDEL immunoblot shows BiP.
*p < 0.05, **p < 0.01, ***p < 0.005. See also Figure S4.

