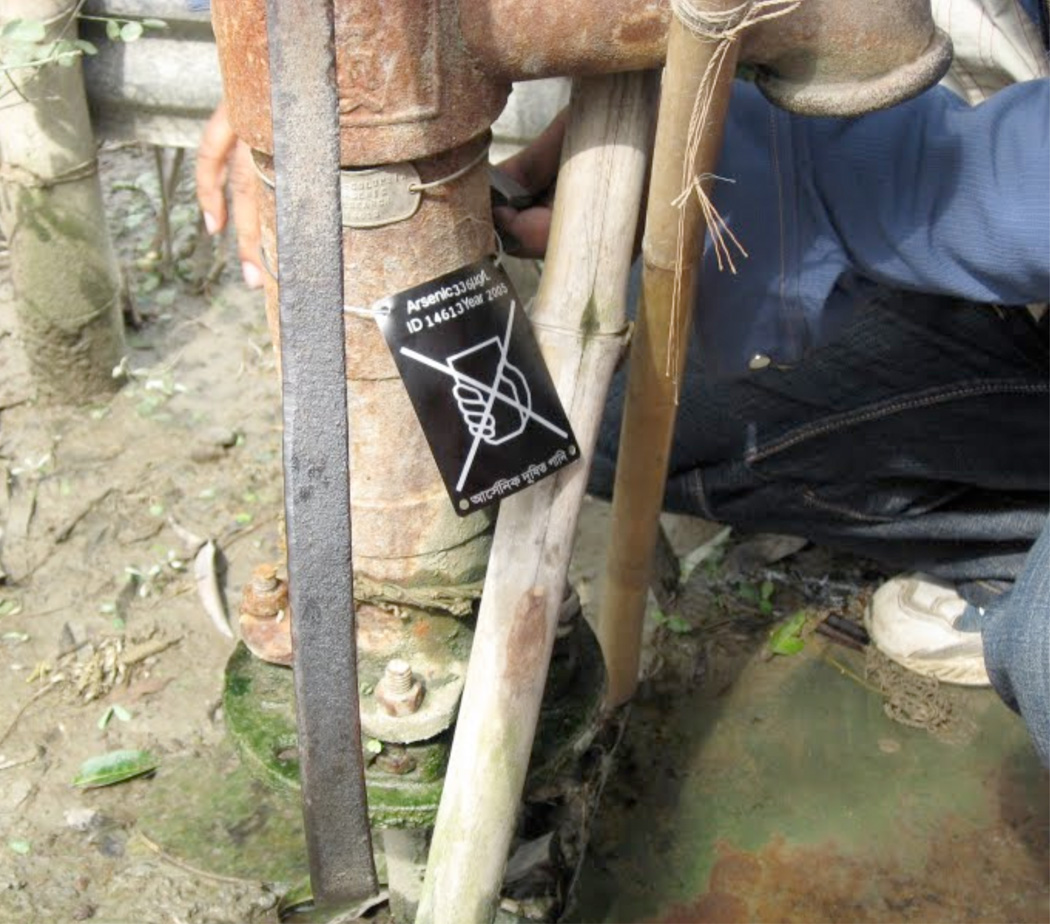
Figure 1. Tubewell and Test Result Plate.
The picture shows an example of the black-and-white plate used to communicate results: the plate indicates the well I.D., the year when the water sample was taken, the arsenic level and a hand holding a drinking cup, in this example crossed out because the arsenic level (336ppb) is above the safety threshold. The smaller, stainless steel plate visible above the black-and-white one indicates the well I.D. and was attached to the well in 2005, at the time of the water sample collection.

