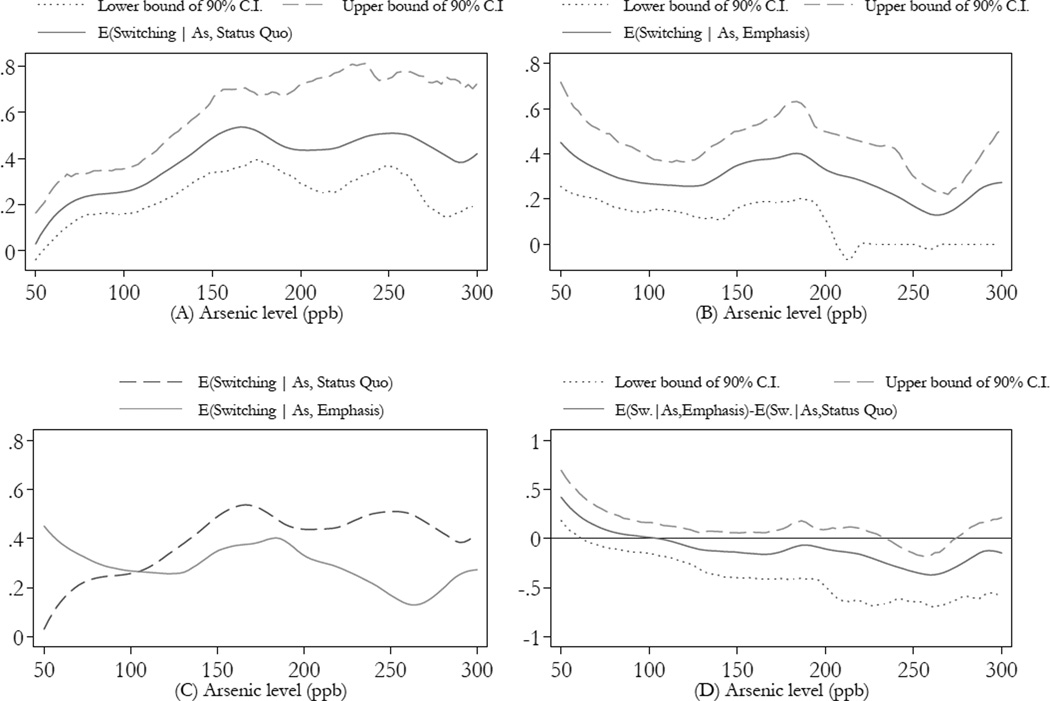
Figure 6. Non-parametric regressions of switching rates on Arsenic levels.
Source: Author’s estimates from follow-up (post-intervention) data. We estimate all regressions using non-parametric locally linear regressions [17], with a bandwidth equal to 50 ppb. The top two panels show switching rates conditional on arsenic levels for unsafe wells in the bright line (graph A, n = 170) and the emphasis (graph B, n = 156) experimental arm respectively. The two graphs are overlapped in panel C. Panel D shows the estimated vertical distances between the two graphs, with 90% confidence bands estimated using block-bootstrap replications. We construct the bands by selecting respectively, the 5th and 95th percentile from the bootstrap distribution of 250 point-specific estimated regressions.

