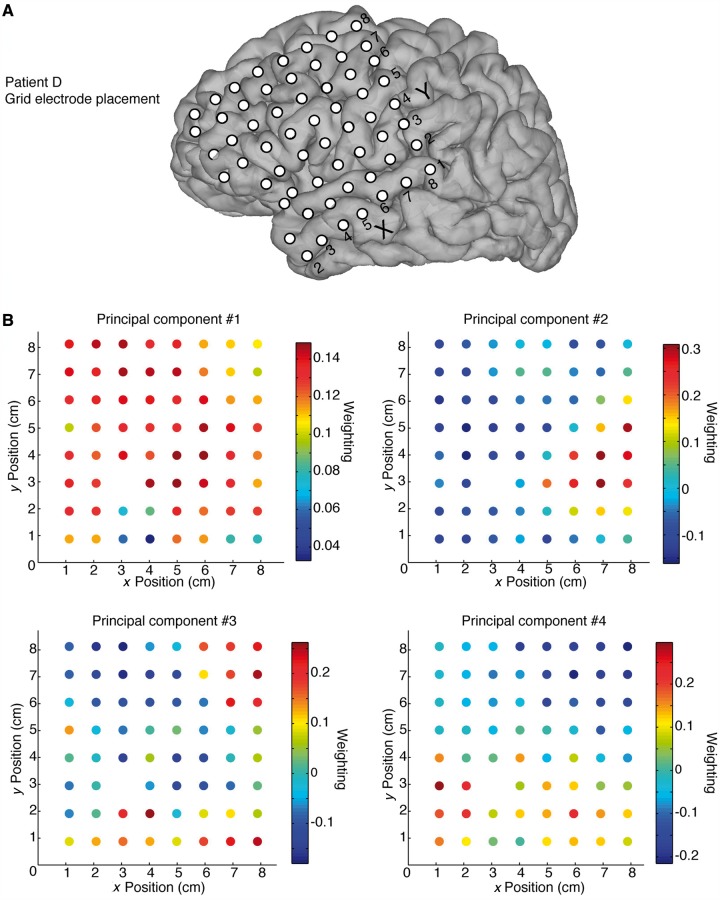
Figure 4.
Principal components analysis demonstrates that bursts are spatially clustered. (A) Reconstruction of the grid electrode placement in Patient D. (B) Each panel shows one of the first four principal components from Patient D, and the colour variation across the grid demonstrates how burst probability is locally differentiated. Each of the components is significantly spatially clustered (P < 0.05), demonstrating that burst properties are anatomically clustered and differ in distant cortical regions.

