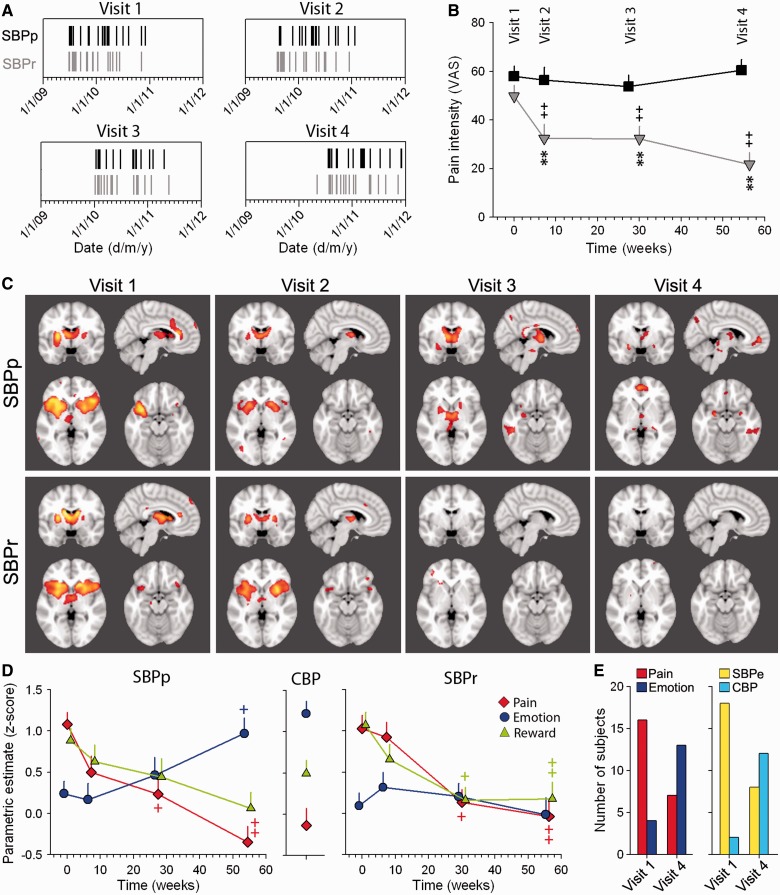
Figure 3.
Longitudinal changes in brain activity underlying spontaneous pain when patients transition from acute to chronic back pain state. (A) Plots show the scanning calendar dates of subjects with recovering SBP (SBPr) and persistent SBP (SBPp) for all four visits. Vertical marks represent individual persistent SBP (black) and recovering SBP (grey) subjects. Groups were scanned within the same time window (major ticks are years; minor ticks are months). (B) Recovering SBP in contrast to persistent SBP patients exhibited decreased pain in time. (C) Group average activation maps (P < 0.01 uncorrected) for recovering and persistent SBP groups at the four visits. Recovering and persistent SBP groups show activation within acute pain regions for visits 1 and 2 encompassing bilateral insula, thalamus and anterior cingulate cortex (ACC). Recovering SBP patients show no significant activity for visits 3 and 4, whereas persistent SBP shows increased activation in the medial prefrontal cortex and amygdala at visit 4. (D) Plots show the group average cope (normalized) for pain, emotion and reward masks, for each group (persistent SBP, CBP, recovering SBP), across all visits. Persistent SBP exhibited decreased presentation of their spontaneous pain within the pain mask. This decrease was coupled with an increased activity within the emotion mask. The middle panel shows CBP activity for all three masks. These values correspond to those we observe in persistent SBP at 1-year scans. In contrast to persistent SBP, the recovering SBP group exhibited decreased activity within all masks in time. (E) Classifier performance applied to individual persistent SBP activation maps for either pain/emotion or CBP/early SBP, at visits 1 and 4. Persistent SBP activity mainly classified as pain or early SBP at visit 1, and as emotion or CBP at visit 4. +P < 0.05, ++P < 0.01, within group comparison to visit 1; **P < 0.01 comparison between groups at a corresponding time.

